When allocating unused memory boosts performance by 2x
Term aggregations are one of the key aggregations in our search engine quickwit. They can give you crucial insight into your logs and a typical query would be to count the number of occurrences per log level over a period of time. In SQL, they would be the equivalent of:
SELECT term, COUNT(*)
GROUP BY term
WHERE <some complicate where clause>;
While they perform excellently at lower cardinalities, like log levels, they are not as performant at higher cardinalities where you might aggregate over an id field. Therefore, I was looking into a specialized data structure that could support higher cardinalities with improved performance and reduced memory consumption.
During performance testing, I stumbled upon a weird performance effect. The throughput of a function increased by 2x when I added a dataset but didn't use it anywhere. Such fluctuations are not unheard of and could be caused by a myriad of things. But this time the code was so unrelated that I had to investigate further, especially since the effect was consistent and not a fluke.
This blogpost is going to be a deep dive where we will fully unravel this mystery and dive deep into the elementals of every program. Some understanding of Rust is beneficial, but not required.
The Performance Effect
The benchmarked function is test_fx_hash_map. It simply counts the number of occurrences of a u32 id into a FxHashMap.
This is in essence what the term aggregation does, where the ids would be term ids.
fn test_fx_hash_map(ids: &[u32]) {
    let mut map = FxHashMap::default();
    for &id in ids {
        *map.entry(id).or_insert(0) += 1;
    }
    black_box(map);
}
I simplified the code that causes the difference to the following:
fn main(){
    {
        // 700MB/s with these two lines, 350MB/s without
        let vals: Vec<u32> = (0..1_000_000 as u32).collect();
        dbg!(vals[0]); // so it doesn't get optimized away by the compiler
    }

    // Benchmark code
    ...
    let data = get_unique_numbers(100_000);
    test_fx_hash_map(data);
}
Yes, that's it. Those two lines and we get 2x performance. git push -f ?
Initially my guess was that this would be some memory artifact, e.g. some accidental cache-line improvement, or it moves the data to a new pointer that improves
cache locality. I enabled the perf integration of my benchmark library binggan to check L1 cache access counters. But they were the same in both variants:
turbo_buckets_vs_fxhashmap_full_unique
100k num elem
FxHashMap    Memory: 1.8 MB                Avg: 346.69 MiB/s (-52.87%)    Median: 349.50 MiB/s (-52.59%)    [310.79 MiB/s .. 357.74 MiB/s]
             L1dAccess: 2284228.850 (+1.18%)    L1dMissed: 305396.283 (+1.18%)      Br: 1075948.887 (+0.04%)          MBr: 3359.792 (+25.27%)
One metric that stands out is the MBr (Missed Branches) that is 25% higher. But that alone is not enough to explain the 2x throughput difference.
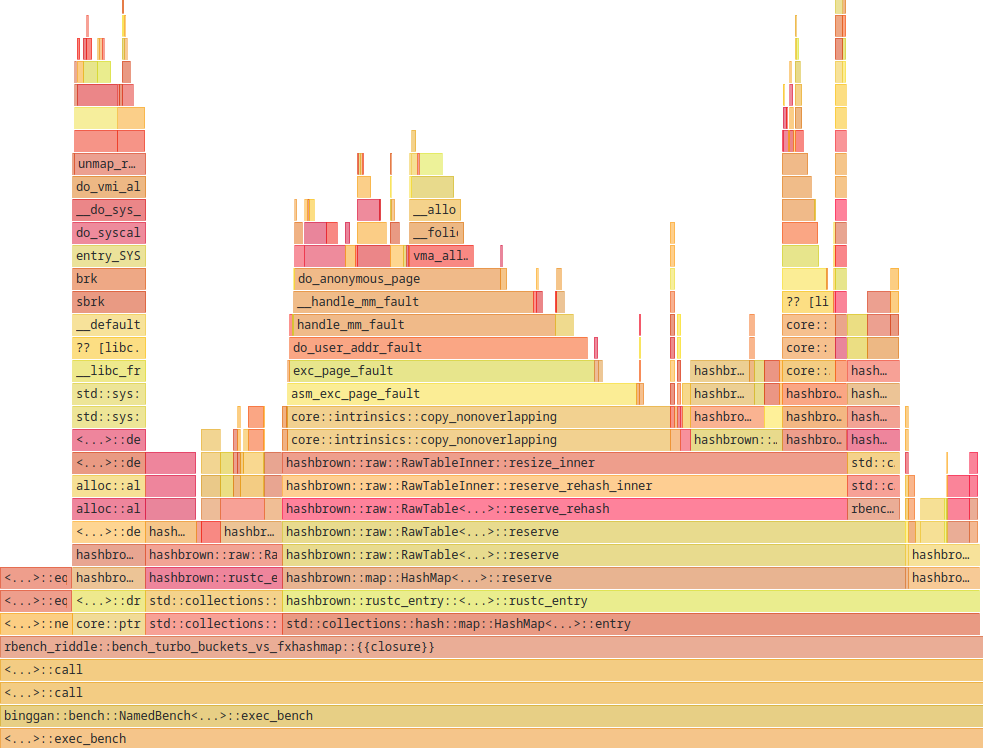
Next in our toolbox of insight is the excellent perf record + Hotspot combo, which
gives us a nice flamegraph of the code.
cargo export target/bench -- bench

perf record -F 1000 -m 8M --aio -z --call-graph dwarf,32768 target/bench/rbench_riddle
To avoid broken stack traces with perf lower the kernel parameter perf_event_paranoid to -1.
Note that setting this parameter like this will reset it after reboot:
echo -1 | sudo tee /proc/sys/kernel/perf_event_paranoid
Page Faults
The profile is from the slow version.
30% of the time is spent in page faults when resizing the table. The copy_nonoverlapping part does not appear in the profile of the fast version.
Rust uses hashbrown as its hashmap.
Below is the code snippet from the resize_inner function. As you can see it uses copy_nonoverlapping to copy the data from the old table to the new table after resizing.
fn resize_inner(){
    // Attempts to allocate a new hash table with at least enough capacity
    // for inserting the given number of elements
    let mut new_table = self.prepare_resize(alloc, layout, capacity, fallibility)?;
    for full_byte_index in self.full_buckets_indices() {
        let hash = hasher(self, full_byte_index);

        let (new_index, _) = new_table.prepare_insert_slot(hash);

        ptr::copy_nonoverlapping(
            self.bucket_ptr(full_byte_index, layout.size),
            new_table.bucket_ptr(new_index, layout.size),
            layout.size,
        );
    }
    ...
}
A page fault in the context of anonymous memory mappings (not backed by a file), occurs when you access virtual memory that is not yet present in the physical memory. The OS will resolve this by allocating a physical page, and mapping it to the virtual address space of the process.
So in the context of the hashmap, the data is not yet backed by physical memory when copying to new_table, therefore a page fault is triggered and the page is loaded into memory.
In contrast, the page fault is not triggered on prepare_resize,
where we just get a virtual memory area reserved, but don't access it yet.
On first impression the slow version does not look unreasonable.
Whenever the hashmap needs to resize, it calls malloc and we get new memory which is not in physical memory, so we get page faults.
Or is it?
Allocation Stack
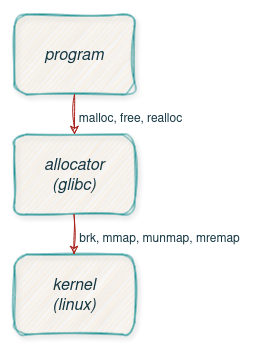
This is how the allocation stack looks like. While the allocator provides methods like malloc, free, realloc, etc. to manage memory, the OS provides mmap, munmap, mremap and brk.
Allocator vs OS Pages
The allocator, glibc in this case, can handle allocation of any sizes, while on the OS level we deal with pages, which are typically 4k in size.
Obviously, if we malloc multiple 4 bytes, the allocator will not get a new 4k page every time from the OS, as that would be terribly wasteful.
So the allocator does manage the pages, and requests more from the OS when needed.
brk increments or decrements the end of the data segment to provide more or less space for the heap.
This adjustment provides the allocator with the necessary space to manage memory dynamically.
mmap on the other hand is used to allocate new memory regions.
They are independent from the heap and typically used for larger allocations. As they are self-contained, they don't cause fragmentation in the allocator.
They also allow avoiding copying data via mremap when e.g. doubling a vec, as the pages of the new memory region can be remapped to the old one.
So far the theory, but when will the allocator get memory from the OS and release it back?
To get more information about that we can use strace,
which lets us log system calls the glibc allocator does to the system.
To add some context, I added debug logs every time the hashmap changes its capacity, and therefore calls the allocator.
We are interested in all calls related to memory mapping and allocation:
strace -e trace=mmap,munmap,mremap,brk target/bench/rbench_riddle
Slow version strace
[First Iteration]
    [rbench_riddle.rs:35:13] hash_map_new_cap = 3
    [rbench_riddle.rs:35:13] hash_map_new_cap = 7
    [rbench_riddle.rs:35:13] hash_map_new_cap = 14
    [rbench_riddle.rs:35:13] hash_map_new_cap = 28
    [rbench_riddle.rs:35:13] hash_map_new_cap = 56
    [rbench_riddle.rs:35:13] hash_map_new_cap = 112
    [rbench_riddle.rs:35:13] hash_map_new_cap = 224
    [rbench_riddle.rs:35:13] hash_map_new_cap = 448
    [rbench_riddle.rs:35:13] hash_map_new_cap = 896
    [rbench_riddle.rs:35:13] hash_map_new_cap = 1792
    [rbench_riddle.rs:35:13] hash_map_new_cap = 3584
    brk(0x559f93a3a000)                     = 0x559f93a3a000
    [rbench_riddle.rs:35:13] hash_map_new_cap = 7168
    # Grows heap by 128Kb
    brk(0x559f93a5e000)                     = 0x559f93a5e000
    [rbench_riddle.rs:35:13] hash_map_new_cap = 14336
    mmap(NULL, 299008, PROT_READ|PROT_WRITE, MAP_PRIVATE|MAP_ANONYMOUS, -1, 0) = 0x7f4646bda000
    # Shrinks heap by 144Kb
    brk(0x559f93a16000)                     = 0x559f93a16000
    [rbench_riddle.rs:35:13] hash_map_new_cap = 28672
    mmap(NULL, 593920, PROT_READ|PROT_WRITE, MAP_PRIVATE|MAP_ANONYMOUS, -1, 0) = 0x7f4646b49000
    munmap(0x7f4646bda000, 299008)          = 0
    [rbench_riddle.rs:35:13] hash_map_new_cap = 57344
    mmap(NULL, 1183744, PROT_READ|PROT_WRITE, MAP_PRIVATE|MAP_ANONYMOUS, -1, 0) = 0x7f4646a28000
    munmap(0x7f4646b49000, 593920)          = 0
    [rbench_riddle.rs:35:13] hash_map_new_cap = 114688
    munmap(0x7f4646a28000, 1183744)         = 0

[Every Iteration AFTER First]
    [rbench_riddle.rs:35:13] hash_map_new_cap = 3
    [rbench_riddle.rs:35:13] hash_map_new_cap = 7
    [rbench_riddle.rs:35:13] hash_map_new_cap = 14
    [rbench_riddle.rs:35:13] hash_map_new_cap = 28
    [rbench_riddle.rs:35:13] hash_map_new_cap = 56
    [rbench_riddle.rs:35:13] hash_map_new_cap = 112
    [rbench_riddle.rs:35:13] hash_map_new_cap = 224
    [rbench_riddle.rs:35:13] hash_map_new_cap = 448
    [rbench_riddle.rs:35:13] hash_map_new_cap = 896
    [rbench_riddle.rs:35:13] hash_map_new_cap = 1792
    [rbench_riddle.rs:35:13] hash_map_new_cap = 3584
    # Grows heap
    brk(0x558642a2d000)                     = 0x558642a2d000
    [rbench_riddle.rs:35:13] hash_map_new_cap = 7168
    brk(0x558642a51000)                     = 0x558642a51000
    [rbench_riddle.rs:35:13] hash_map_new_cap = 14336
    brk(0x558642a99000)                     = 0x558642a99000
    [rbench_riddle.rs:35:13] hash_map_new_cap = 28672
    brk(0x558642b29000)                     = 0x558642b29000
    [rbench_riddle.rs:35:13] hash_map_new_cap = 57344
    brk(0x558642c49000)                     = 0x558642c49000
    [rbench_riddle.rs:35:13] hash_map_new_cap = 114688
    # Shrinks heap
    brk(0x558642a09000)                     = 0x558642a09000
Fast version strace
[1 million element vec]
    mmap(NULL, 4001792, PROT_READ|PROT_WRITE, MAP_PRIVATE|MAP_ANONYMOUS, -1, 0) = 0x7f6d89df2000  // Allocating 1mio u32 = 4MB
    [rbench_riddle.rs:53:9] vals[0] = 0
    munmap(0x7f6d89df2000, 4001792)         = 0
...
[First Iteration]
    [rbench_riddle.rs:35:13] hash_map_new_cap = 3
    [rbench_riddle.rs:35:13] hash_map_new_cap = 7
    [rbench_riddle.rs:35:13] hash_map_new_cap = 14
    [rbench_riddle.rs:35:13] hash_map_new_cap = 28
    [rbench_riddle.rs:35:13] hash_map_new_cap = 56
    [rbench_riddle.rs:35:13] hash_map_new_cap = 112
    [rbench_riddle.rs:35:13] hash_map_new_cap = 224
    [rbench_riddle.rs:35:13] hash_map_new_cap = 448
    [rbench_riddle.rs:35:13] hash_map_new_cap = 896
    [rbench_riddle.rs:35:13] hash_map_new_cap = 1792
    [rbench_riddle.rs:35:13] hash_map_new_cap = 3584
    [rbench_riddle.rs:35:13] hash_map_new_cap = 7168
    # Grow Heap
    brk(0x55e0cd598000)                     = 0x55e0cd598000
    [rbench_riddle.rs:35:13] hash_map_new_cap = 14336
    # Grow Heap
    brk(0x55e0cd5e0000)                     = 0x55e0cd5e0000
    [rbench_riddle.rs:35:13] hash_map_new_cap = 28672
    # Grow Heap
    brk(0x55e0cd670000)                     = 0x55e0cd670000
    [rbench_riddle.rs:35:13] hash_map_new_cap = 57344
    mmap(NULL, 1183744, PROT_READ|PROT_WRITE, MAP_PRIVATE|MAP_ANONYMOUS, -1, 0) = 0x7f906f4c2000
    [rbench_riddle.rs:35:13] hash_map_new_cap = 114688
    munmap(0x7f906f4c2000, 1183744)         = 0
[Second Iteration]
    [rbench_riddle.rs:35:13] hash_map_new_cap = 3
    [rbench_riddle.rs:35:13] hash_map_new_cap = 7
    [rbench_riddle.rs:35:13] hash_map_new_cap = 14
    [rbench_riddle.rs:35:13] hash_map_new_cap = 28
    [rbench_riddle.rs:35:13] hash_map_new_cap = 56
    [rbench_riddle.rs:35:13] hash_map_new_cap = 112
    [rbench_riddle.rs:35:13] hash_map_new_cap = 224
    [rbench_riddle.rs:35:13] hash_map_new_cap = 448
    [rbench_riddle.rs:35:13] hash_map_new_cap = 896
    [rbench_riddle.rs:35:13] hash_map_new_cap = 1792
    [rbench_riddle.rs:35:13] hash_map_new_cap = 3584
    [rbench_riddle.rs:35:13] hash_map_new_cap = 7168
    [rbench_riddle.rs:35:13] hash_map_new_cap = 14336
    [rbench_riddle.rs:35:13] hash_map_new_cap = 28672
    [rbench_riddle.rs:35:13] hash_map_new_cap = 57344
    # Grow Heap
    brk(0x55e0cd790000)                     = 0x55e0cd790000
    [rbench_riddle.rs:35:13] hash_map_new_cap = 114688

[Every Iteration AFTER that]
    [rbench_riddle.rs:35:13] hash_map_new_cap = 3
    [rbench_riddle.rs:35:13] hash_map_new_cap = 7
    [rbench_riddle.rs:35:13] hash_map_new_cap = 14
    [rbench_riddle.rs:35:13] hash_map_new_cap = 28
    [rbench_riddle.rs:35:13] hash_map_new_cap = 56
    [rbench_riddle.rs:35:13] hash_map_new_cap = 112
    [rbench_riddle.rs:35:13] hash_map_new_cap = 224
    [rbench_riddle.rs:35:13] hash_map_new_cap = 448
    [rbench_riddle.rs:35:13] hash_map_new_cap = 896
    [rbench_riddle.rs:35:13] hash_map_new_cap = 1792
    [rbench_riddle.rs:35:13] hash_map_new_cap = 3584
    [rbench_riddle.rs:35:13] hash_map_new_cap = 7168
    [rbench_riddle.rs:35:13] hash_map_new_cap = 14336
    [rbench_riddle.rs:35:13] hash_map_new_cap = 28672
    [rbench_riddle.rs:35:13] hash_map_new_cap = 57344
    [rbench_riddle.rs:35:13] hash_map_new_cap = 114688
Did you spot the difference?
Syscall Comparison
The slow version has multiple calls to mmap in the first iteration.
After that all iterations don't use any mmap, but increase the heap via brk.
And most importantly we have a brk call that shrinks the heap at the end of each iteration, which means the memory is released back to the OS.
So in every iteration we grow the heap and shrink it back at the end.
The fast version has only one call to mmap in the first iteration. One brk to grow the heap in the second iteration, and then no syscalls at all.
That means after that the memory is managed by the allocator and it does not need any more memory from the OS.
M_MMAP_THRESHOLD and M_TRIM_THRESHOLD
The allocator decides if an allocation is allocated on the heap or gets its own memory region via mmap.
In libc the parameter M_MMAP_THRESHOLD is used to determine when to use mmap instead of brk.
The default value is 128kb, but it can be set via the environment variable MALLOC_MMAP_THRESHOLD_ or a function call to mallopt.
The allocator also grows and shrinks the heap via brk.
The parameter M_TRIM_THRESHOLD is used to determine when to release memory back to the OS.
The default value is 128kb, but can be set via the environment variable MALLOC_TRIM_THRESHOLD_.
The answer to the different behaviour between the two variants lies in the behaviour of the glibc allocator:
Note: Nowadays, glibc uses a dynamic mmap threshold by default. The initial value of the threshold is 128*1024, but when blocks larger than the current threshold and less than or equal to DEFAULT_MMAP_THRESHOLD_MAX (4MB) are freed, the threshold is adjusted upward to the size of the freed block. When dynamic mmap thresholding is in effect, the threshold for trimming the heap is also dynamically adjusted to be twice the dynamic mmap threshold.
So the first 4MB allocation in the fast version affects those parameters.
Most importantly the M_TRIM_THRESHOLD is set to 8MB, so the allocator does not release memory back to the OS.
With that knowledge we should be able to replicate that behaviour of the fast version.
We set the M_MMAP_THRESHOLD_ to 4MB and MALLOC_TRIM_THRESHOLD_ to -1, so the allocator does not release memory back to the OS.
MALLOC_MMAP_THRESHOLD_=4000000 MALLOC_TRIM_THRESHOLD_=-1 cargo bench
Which indeed has a throughput of 700MB/s. We need to set both parameters, or the allocator will start using MMAPs too liberally and
we get the exact same performance issue (page faults). We can also test what happens if we only use mmaps to back our data, which gives
use the most terrible performance of 330MB/s: MALLOC_MMAP_THRESHOLD_=0 cargo bench.
Hashmap vs Vec
One important thing to note is that memory behaviour of a Hashmap is different from a Vec. With a Vec we can use mremap to resize the memory region,
and since a Vec doubles every time, we can reuse half of the memory without page faults. This can be demonstrated with a trivial example:
fn main() {
    let mut data = Vec::new();
    for value in 0..(1 << 20){
        data.push(value);
    }
    dbg!(data[0]);
}
mmap(NULL, 266240, PROT_READ|PROT_WRITE, MAP_PRIVATE|MAP_ANONYMOUS, -1, 0) = 0x7f9266729000
mremap(0x7f9266729000, 266240, 528384, MREMAP_MAYMOVE) = 0x7f92666a8000
mremap(0x7f92666a8000, 528384, 1052672, MREMAP_MAYMOVE) = 0x7f92665a7000
mremap(0x7f92665a7000, 1052672, 2101248, MREMAP_MAYMOVE) = 0x7f92663a6000
mremap(0x7f92663a6000, 2101248, 4198400, MREMAP_MAYMOVE) = 0x7f9265fa5000
[src/main.rs:8:5] data[0] = 0
With a Hashmap we need to copy the data, and the allocator may give us a new mmaped region.
Proper sizing via Hashmap::with_capacity has therefore a much higher impact than Vec::with_capacity.
fn main() {
    let mut data = HashSet::new();
    for value in 0..(1 << 20) {
        data.insert(value);
    }
    dbg!(data.get(&0));
}
brk(0x560f4cfe9000)                     = 0x560f4cfe9000
mmap(NULL, 167936, PROT_READ|PROT_WRITE, MAP_PRIVATE|MAP_ANONYMOUS, -1, 0) = 0x7fec109ff000
brk(0x560f4cfc2000)                     = 0x560f4cfc2000
mmap(NULL, 331776, PROT_READ|PROT_WRITE, MAP_PRIVATE|MAP_ANONYMOUS, -1, 0) = 0x7fec10794000
munmap(0x7fec109ff000, 167936)          = 0
mmap(NULL, 659456, PROT_READ|PROT_WRITE, MAP_PRIVATE|MAP_ANONYMOUS, -1, 0) = 0x7fec106f3000
munmap(0x7fec10794000, 331776)          = 0
mmap(NULL, 1314816, PROT_READ|PROT_WRITE, MAP_PRIVATE|MAP_ANONYMOUS, -1, 0) = 0x7fec105b2000
munmap(0x7fec106f3000, 659456)          = 0
mmap(NULL, 2625536, PROT_READ|PROT_WRITE, MAP_PRIVATE|MAP_ANONYMOUS, -1, 0) = 0x7fec10331000
munmap(0x7fec105b2000, 1314816)         = 0
mmap(NULL, 5246976, PROT_READ|PROT_WRITE, MAP_PRIVATE|MAP_ANONYMOUS, -1, 0) = 0x7fec0fe30000
munmap(0x7fec10331000, 2625536)         = 0
mmap(NULL, 10489856, PROT_READ|PROT_WRITE, MAP_PRIVATE|MAP_ANONYMOUS, -1, 0) = 0x7fec0f42f000
munmap(0x7fec0fe30000, 5246976)         = 0
[src/main.rs:10:5] data.get(&0) = Some(
    0,
)
Conclusion
If you see your program page faulting for MAP_ANONYMOUS mmaped data, which is not backed by a file, you may want to consider
strategies to mitigate that. One strategy would be to avoid releasing memory back to the OS or the allocator.
The repo to test it for yourself is here: https://github.com/PSeitz/bench_riddle