Grafana Plugin 0.3: Towards Application Performance Monitoring
Shortly after the release of Quickwit 0.7 version, we are excited to announce the general availability of Grafana Plugin 0.3 for Quickwit. This release opens up new advanced visualization capabilities built on top of our cloud-native search engine.
Querying billions of logs and traces in Grafana
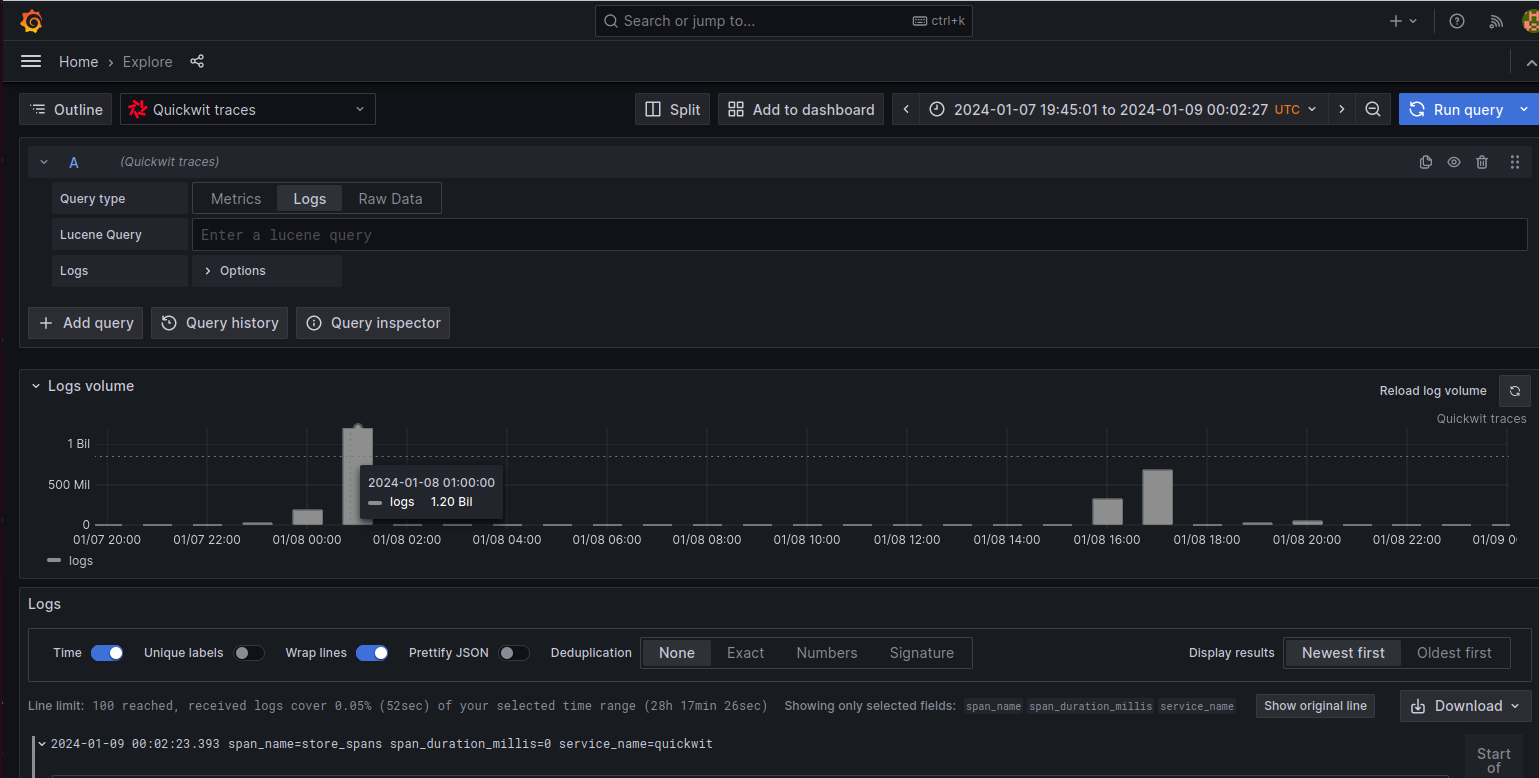
With the 0.7 performance boost, it’s now even easier to search and analyze billions of spans or logs sitting on your favorite object storage. A few days ago, we showcased the Grafana plugin at the Cloud Native London meetup, playing with a dataset of 2.5 billion spans (almost) without sweating.
Below is a screenshot where we query around 2 billion spans and build a date histogram from them. I ran those queries with 2 and 10 nodes, and each time, the UI was snappy.
However, performance is not all; it is worth it only if you can derive valuable insights into your infrastructure, applications, or business indicators and correlate all your signals! That’s the core direction of our latest developments; let’s dive into it.
New powerful features
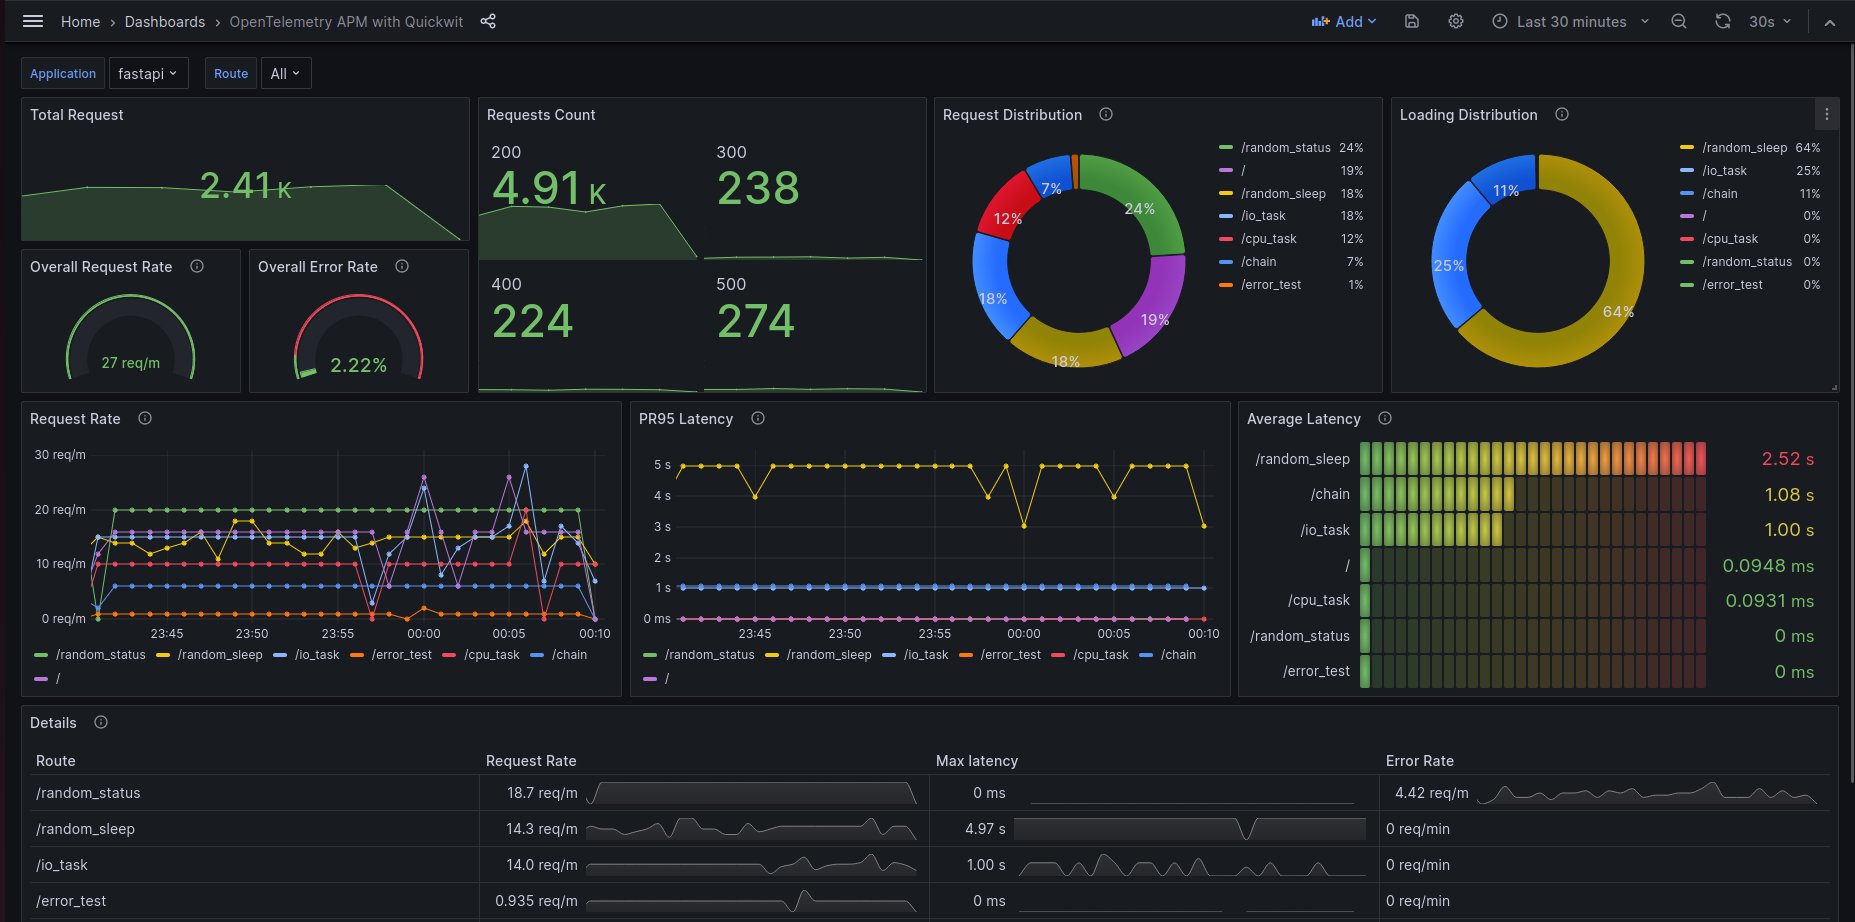
Application Performance Monitoring Dashboards
APM dashboards built on top of your traces index are now possible. You can derive trends, percentiles, and distributions and create valuable visualizations to monitor your applications.
We have just started exploiting those capabilities and will share in the coming days a tutorial to build some gorgeous dashboards like this one on top Quickwit 💕
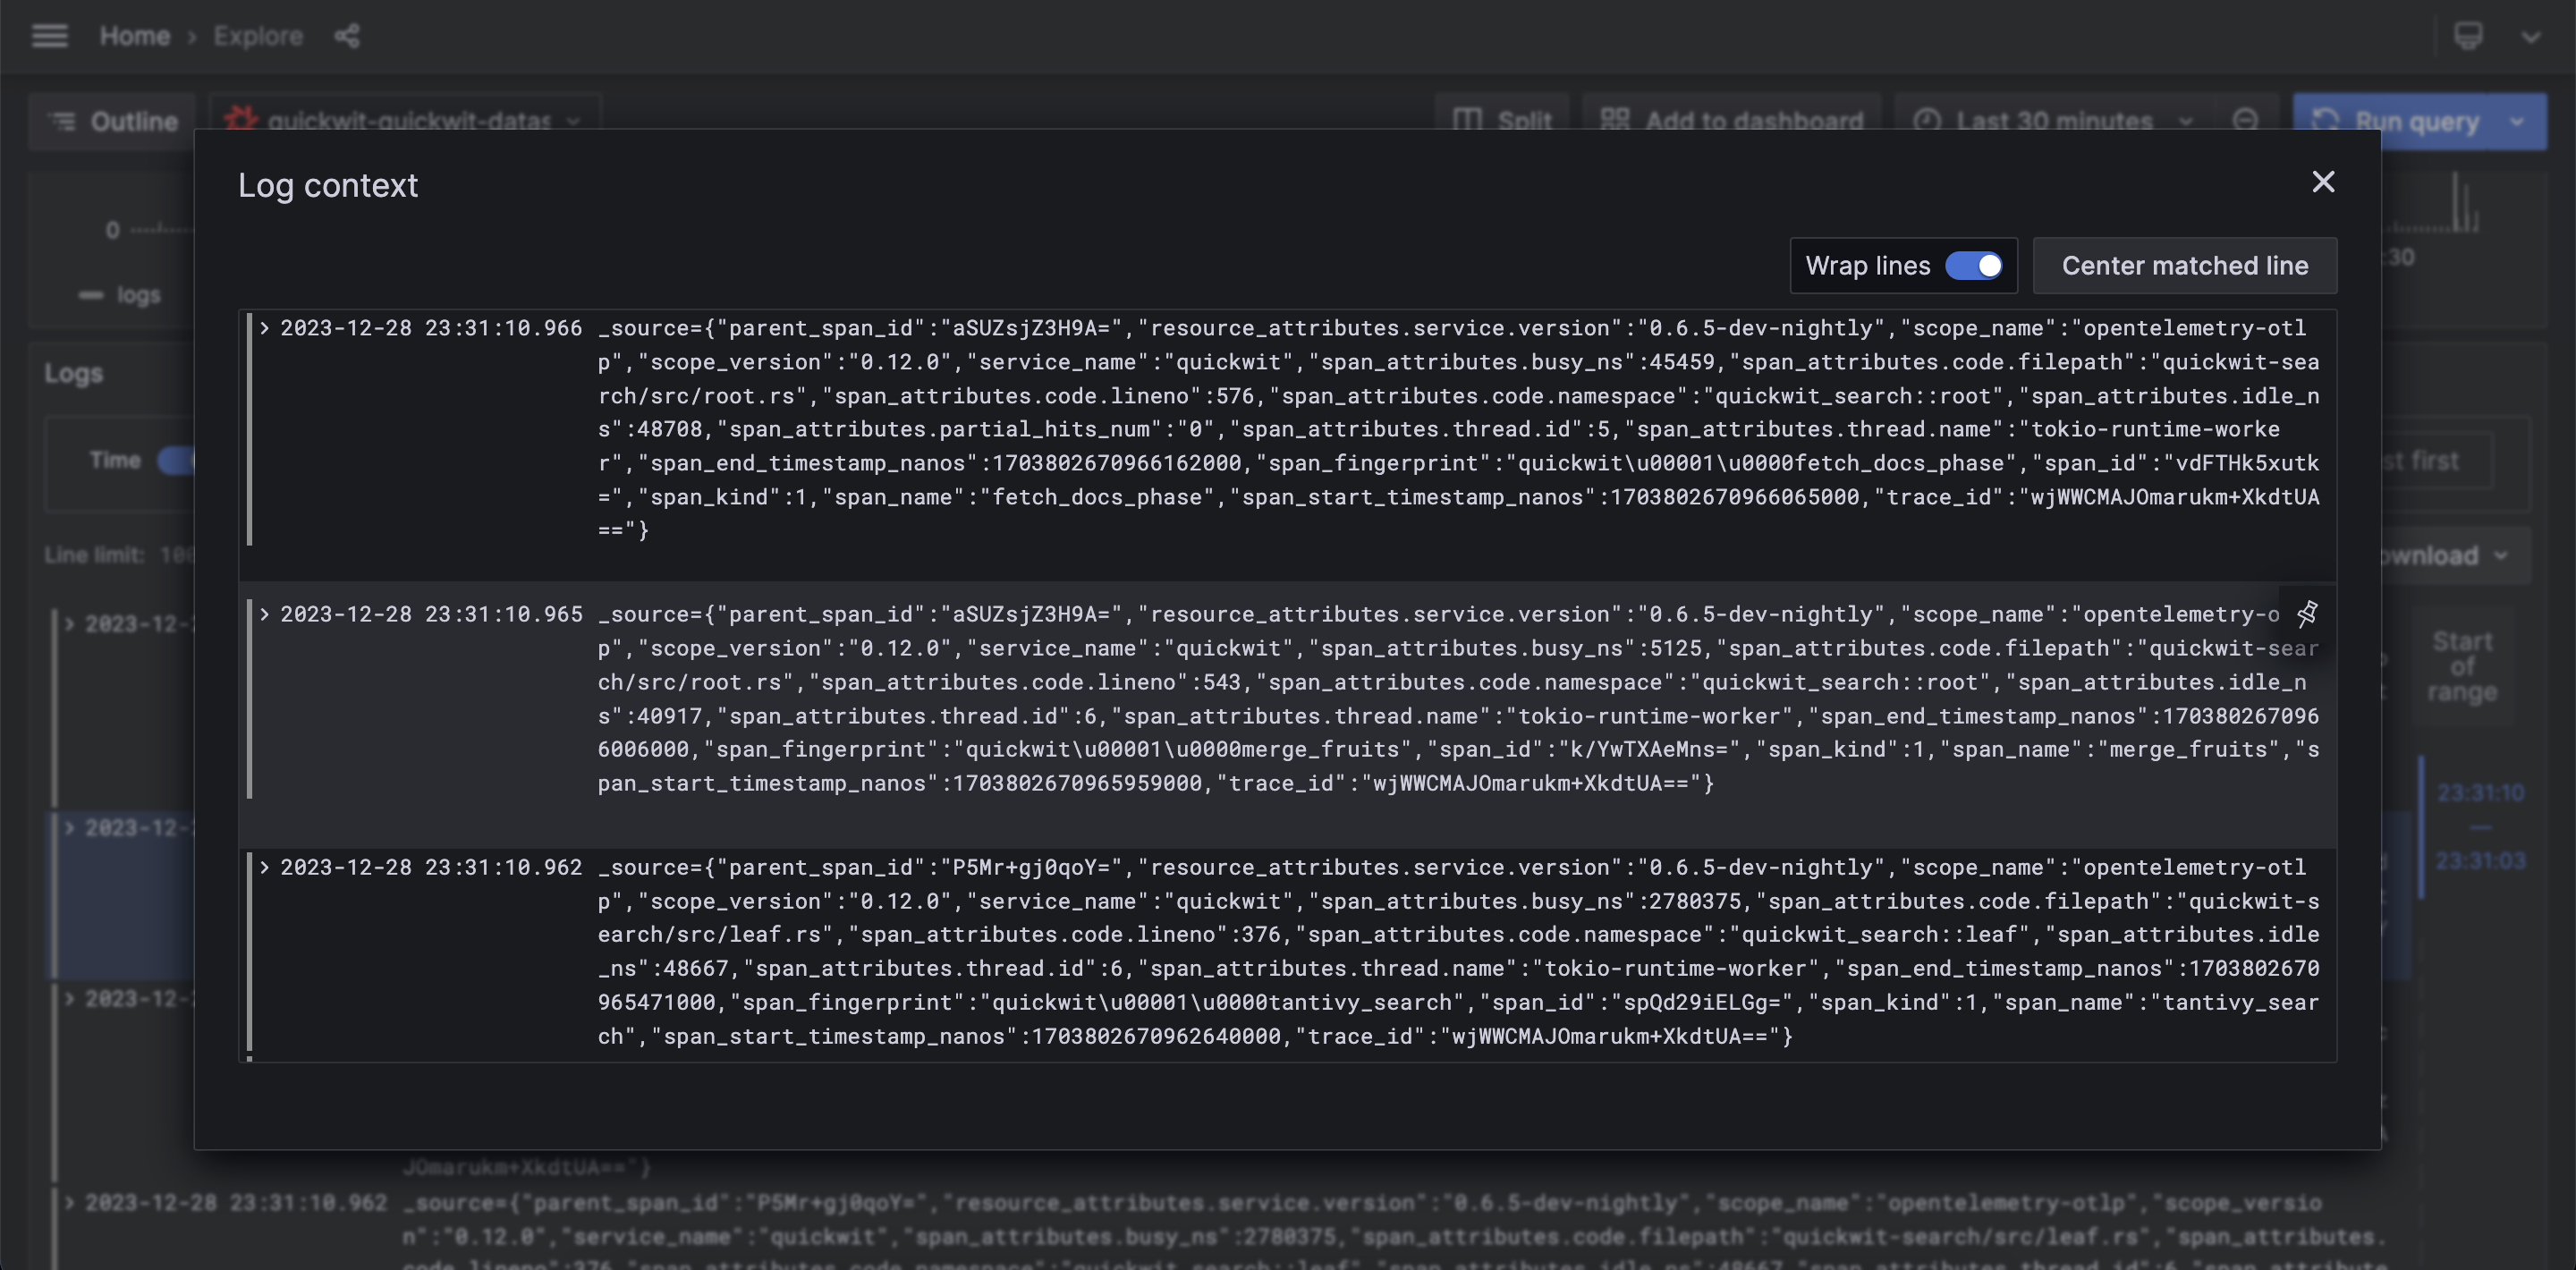
Context View in Explore
This feature allows you to explore the context around one selected log line, as shown in the image below. While already very practical, the feature is still incomplete since you can’t refine the “context” by adding some filters, for instance. This will come in 0.3.1 soon.
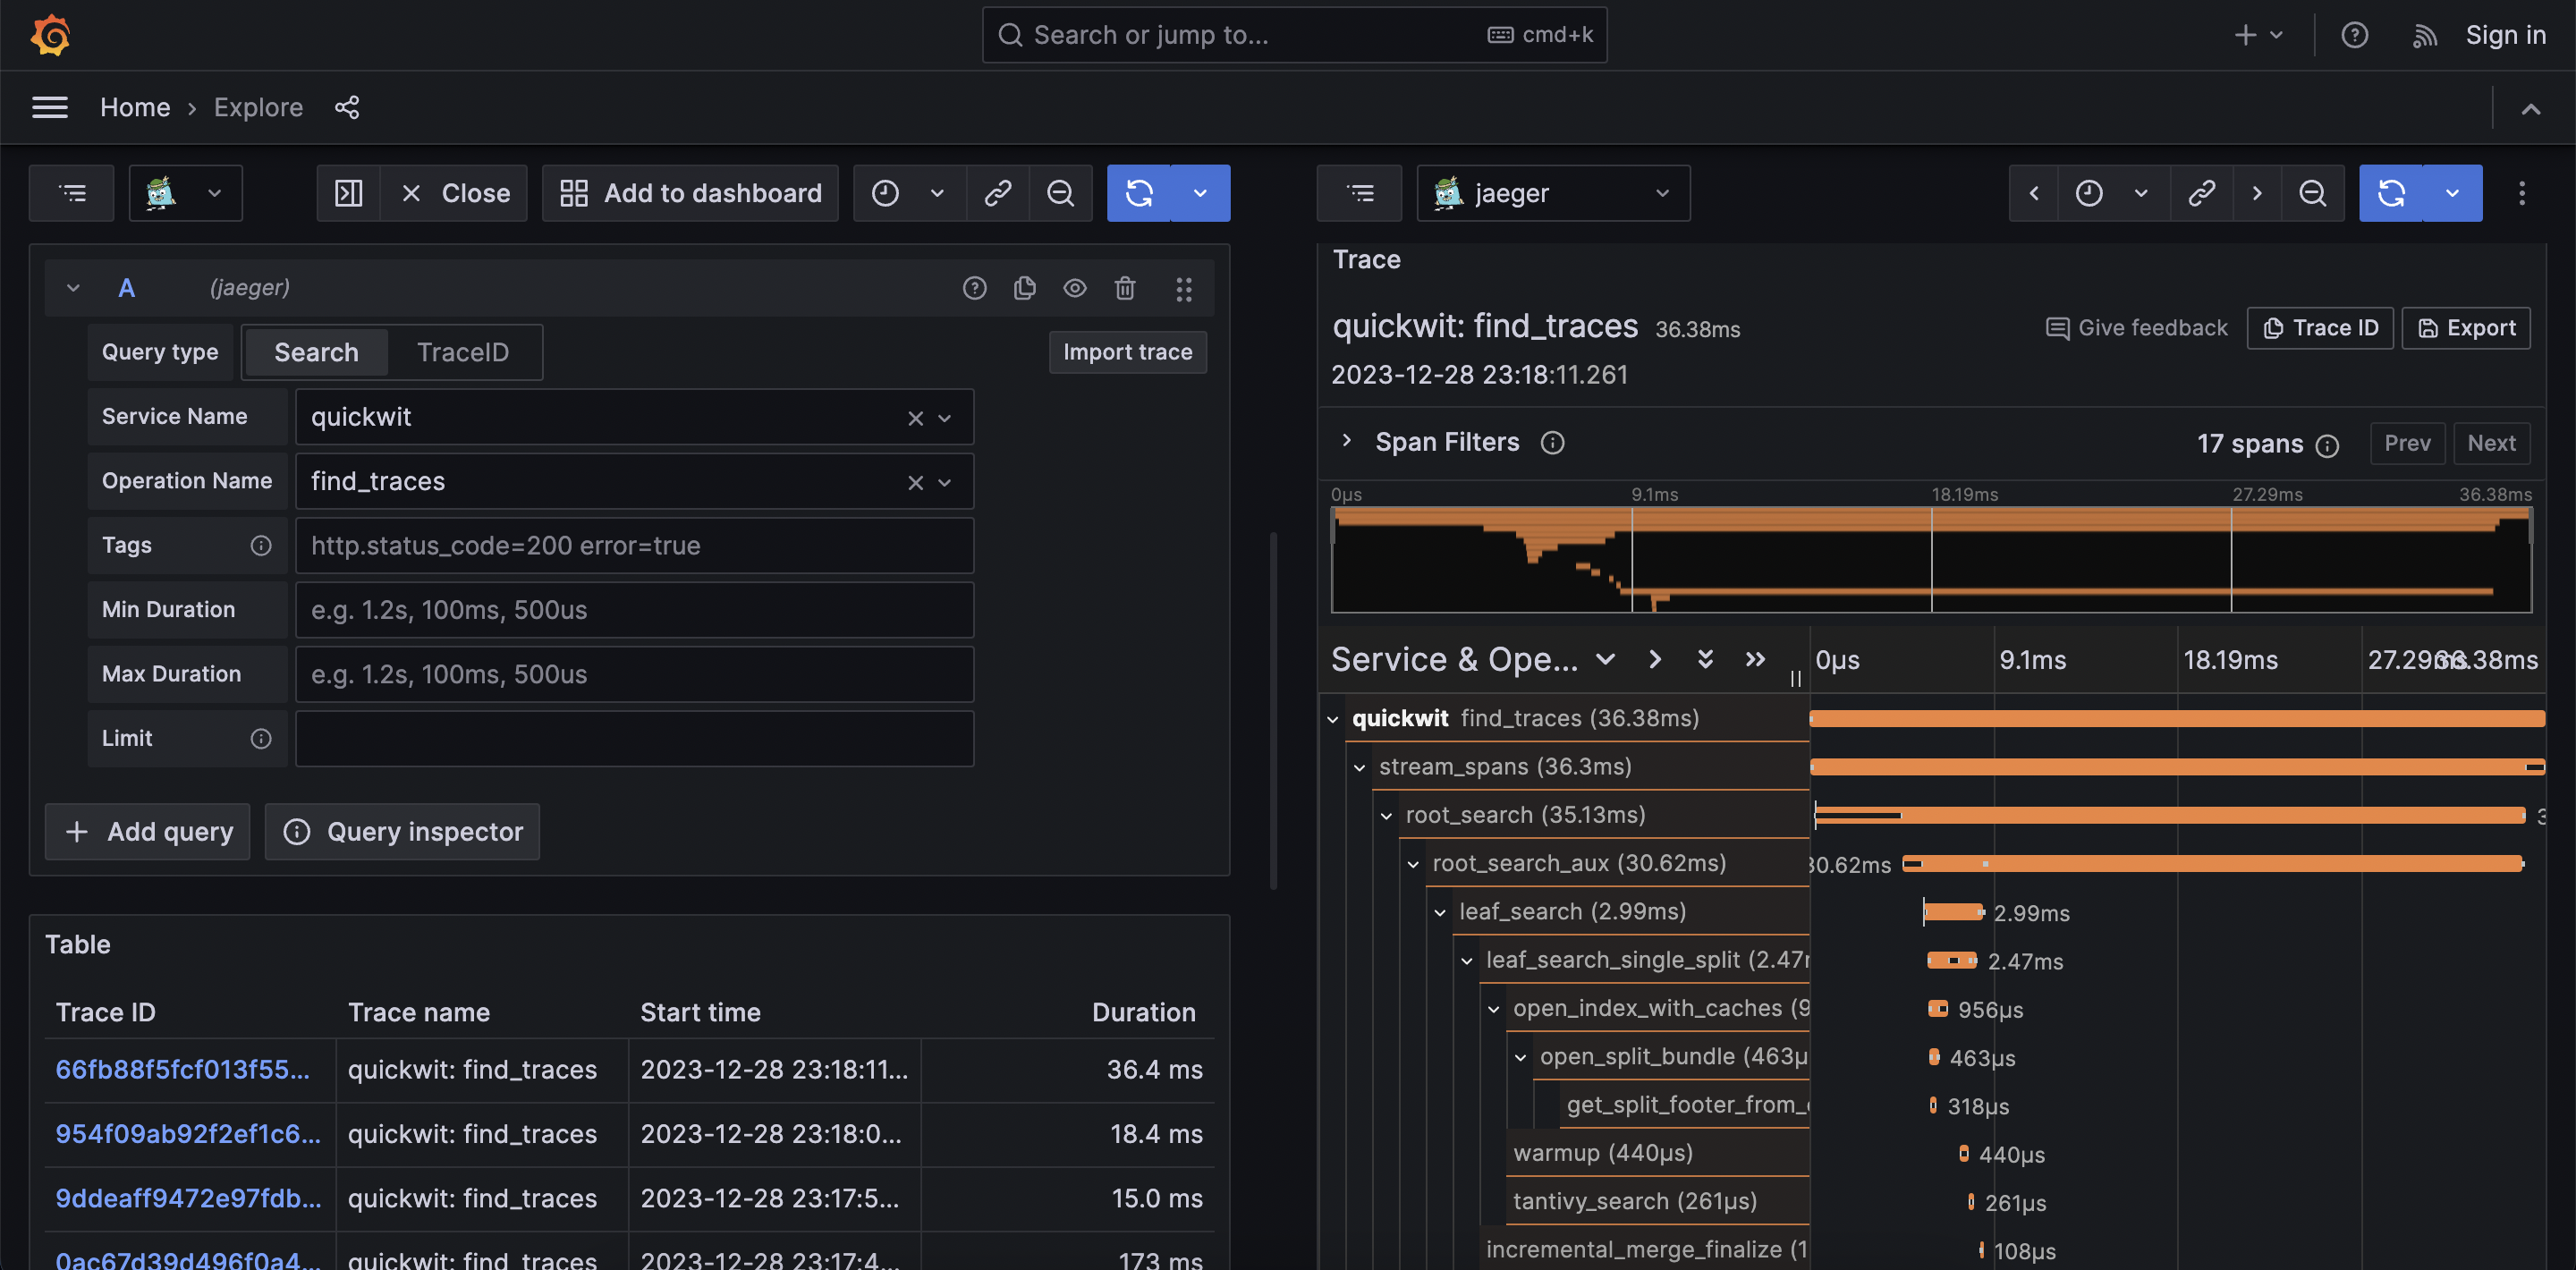
Trace Search and Trace View
Though not directly related to the plugin, Quickwit 0.7 now offers a Jaeger-compatible REST API, which allows the use of the Grafana Jaeger Plugin with Quickwit. With a Quickwit instance up and running, you can now create a Quickwit and a Jaeger data source and link them up!
Linking Logs or Spans to Traces
Connecting the information in your logs or traces with the detailed context provided by traces is now possible. It makes navigating between a single log/span and understanding what happened in your application easier.
And more!
In this release, we also simplified the creation of a Quickwit data source; you don’t have to specify the timestamp field name and format; those parameters are now automatically fetched from the Quickwit cluster.
To review the exhaustive list of changes shipped in this release, please refer to our CHANGELOG.
What’s next?
We have already started working on the next release. Here are some of the next improvements to come:
- Add keyword highlight in the Explore view
- Improve the context feature
- Add new aggregations such as count, cardinality, rate, and multi-terms…
Starting Grafana and Quickwit
Your first stop is our quick start tutorial on trace analytics. We will add soon more contents about it, stay tuned!
The plugin is still relatively new, and any feedback/contributions is always appreciated! Here is the GitHub Repository.