Logs and Traces with Grafana
In this tutorial, we will set up a Grafana Dashboard showing Quickwit traces using Docker Compose.
You only need a few minutes to get Grafana working with Quickwit and build meaningful dashboards.
Create a Docker Compose recipe
Let's add a Quickwit instance with the OTLP service enabled.
version: '3.0'
services:
  quickwit:
    image: quickwit/quickwit
    environment:
      QW_ENABLE_OPENTELEMETRY_OTLP_EXPORTER: "true"
      OTEL_EXPORTER_OTLP_ENDPOINT: "http://localhost:7281"
    ports:
      - 7280:7280
    command: ["run"]
Then we create a Grafana service with the Quickwit Datasource plugin.
  grafana:
    image: grafana/grafana-oss
    container_name: grafana
    ports:
      - "${MAP_HOST_GRAFANA:-127.0.0.1}:3000:3000"
    environment:
      GF_INSTALL_PLUGINS: https://github.com/quickwit-oss/quickwit-datasource/releases/download/v0.3.1/quickwit-quickwit-datasource-0.3.1.zip;quickwit-quickwit-datasource
      GF_AUTH_DISABLE_LOGIN_FORM: "true"
      GF_AUTH_ANONYMOUS_ENABLED: "true"
      GF_AUTH_ANONYMOUS_ORG_ROLE: Admin
Save and run the recipe:
$ docker compose up
You should be able to access Quickwit's UI on http://localhost:7280/ and Grafana's UI on http://localhost:3000/.
Setting up the datasource
In Grafana, head to Data Sources. If the plugin is installed correctly you should be able to find Quickwit in the list.
We're going to set up a new Quickwit data source looking at Quickwit's own OpenTelemetry traces, let's configure the datasource with the following parameters:
- URL :
http://quickwit:7280/api/v1This uses the docker service name as the host - Index ID :
otel-traces-v0_7
Save and test, you should obtain a confirmation that the datasource is correctly set up.

You can also set up a new Quickwit data source looking at Quickwit's own OpenTelemetry logs (or your own logs index), let's configure the datasource with the following parameters:
- URL :
http://quickwit:7280/api/v1This uses the docker service name as the host - Index ID :
otel-logs-v0_7
Creating a dashboard
You can then create a new dashboard and add a visualization : you should be able to choose the traces quickwit datasource here.
Quickwit sends itself its own traces, so you should already have data to display. Let's configure some panels !
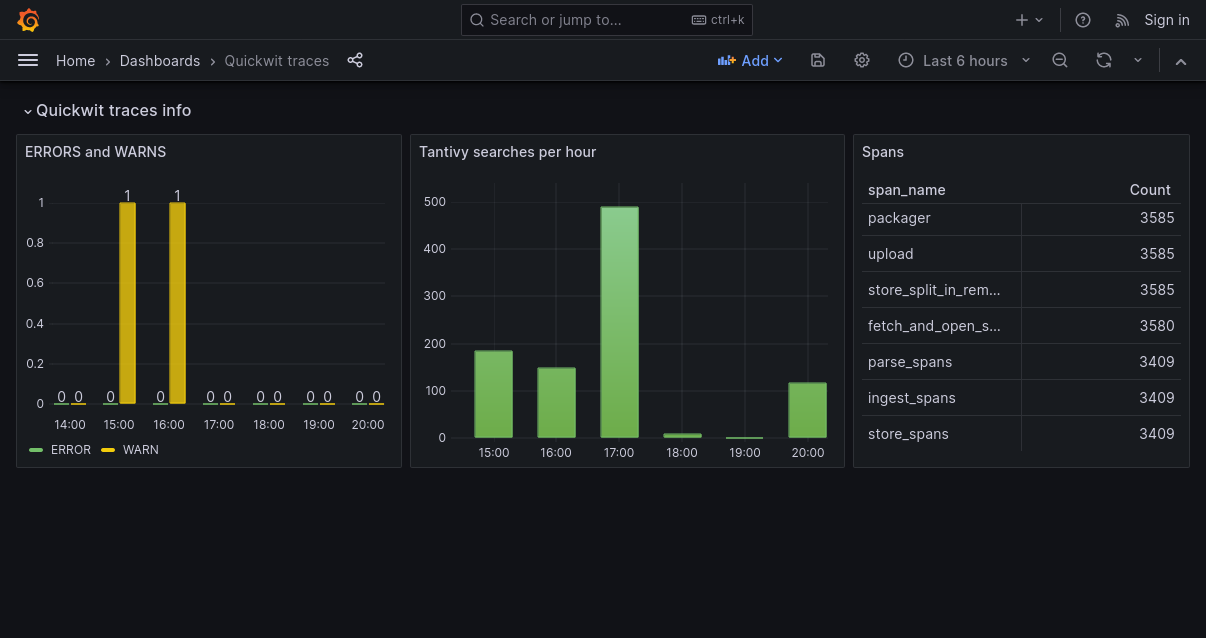
- a Table counting span_names
- Panel type : Table
- Query: empty
- Metric : Count
- Group by : Terms :
span_name: order by Count
- a Bar Chart showing the amount of tantivy searches per hour :
- Panel type: Time Series
- Query : "span_name:tantivy_search"
- Metric: Count
- Group by : Date Histogram :
span_start_timestamp_nanos: Interval 1h
- a Bar Chart showing the amount of ERROR logs per hour for the last 6 hours :
- Panel type: Bar Chart
- Query: "service_name:quickwit AND events.event_attributes.level:ERROR"
- Metric: Count
- Group by : Terms :
span_start_timestamp_nanos: Interval 1h
- another query on the same Bar Chart for WARN logs
The result
Here's what your first dashboard can look like :