Quickwit is now an official Jaeger storage backend!
Quickwit, our open-source search engine designed for logs and tracing, has recently been listed as an officially supported Jaeger backend! This is fantastic news for developers who are looking for an efficient, reliable, and cost-effective way to trace and monitor their distributed systems. In this blog post, we will walk you through the steps to trace a Node.js web application with Quickwit and Jaeger.
Requirements:
This walkthrough will assume you have installed and can correctly run the following software on your system:
Quickwit 0.6.1Node.js 16+Docker
A basic Node.js application to generate traces
We will create a basic Node.js express application that generates traces by doing three things on each HTTP call to this endpoint http://localhost:5000/process-ip:
- Fetch an IP address from https://httpbin.org/ip.
- Parse it and fake processing with a random sleep.
- Display it with a random sleep.
Create the project and install the dependencies
Make a directory, navigate to it in your terminal, and run the following commands to initialize and install dependencies of the project.
npm init -yes
npm install --save express node-fetch@2 \
    @opentelemetry/sdk-node \
    @opentelemetry/exporter-trace-otlp-grpc \
    @opentelemetry/auto-instrumentations-node
expressFast, unopinionated, minimalist web framework for Node.js.node-fetchA light-weight module that brings Fetch API to Node.js.@opentelemetry/sdk-nodeprovides the full OpenTelemetry SDK for Node.js including tracing and metrics.@opentelemetry/exporter-trace-otlp-grpcprovides an exporter for Node.js to be used with OTLP grpc-compatible receivers.@opentelemetry/auto-instrumentations-nodeprovides a simple way to initialize multiple Node.js instrumentation.
Write the application code
First, let's create a file called tracing.js in which we are going to configure the tracing of our Node.js application.
// tracing.js

// OpenTelemetry
const { Resource } = require("@opentelemetry/resources");
const { SemanticResourceAttributes } = require("@opentelemetry/semantic-conventions");
const { SimpleSpanProcessor,ConsoleSpanExporter } = require("@opentelemetry/sdk-trace-base");
const { NodeTracerProvider } = require("@opentelemetry/sdk-trace-node");
const { trace, context } = require("@opentelemetry/api");
// exporter
const { OTLPTraceExporter } = require("@opentelemetry/exporter-trace-otlp-grpc");
// instrumentations
const { ExpressInstrumentation } = require("@opentelemetry/instrumentation-express");
const { HttpInstrumentation } = require("@opentelemetry/instrumentation-http");
const { registerInstrumentations } = require("@opentelemetry/instrumentation");

module.exports = (serviceName, exporterEndpoint) => {
  const exporter = new OTLPTraceExporter({
    url: exporterEndpoint,
  });

  // Configure & register the tracing provider.
  const provider = new NodeTracerProvider({
    resource: new Resource({
      [SemanticResourceAttributes.SERVICE_NAME]: serviceName,
    }),
  });
  // Processor to show traces in the console.
  provider.addSpanProcessor(new SimpleSpanProcessor(new ConsoleSpanExporter()));
  // Processor to send traces to Quickwit.
  provider.addSpanProcessor(new SimpleSpanProcessor(exporter));
  provider.register();

  // Register auto instrumentations for HTTP and express.js.
  registerInstrumentations({
    instrumentations: [new HttpInstrumentation(), new ExpressInstrumentation()],
    tracerProvider: provider,
  });

  // Return a helper to work with the configured tracer.
  const tracer = trace.getTracer(serviceName);
  return {
    tracer: tracer,
    startSpan: (name, parentSpan) => {
      const ctx = parentSpan
        ? trace.setSpan(context.active(), parentSpan)
        : undefined;
      return tracer.startSpan(name, undefined, ctx);
    },
  };
};
Next, let’s write our Node.js application while adding some manual instrumentation. The focus is not on what this application does but on making sure we can generate exploitable tracing data.
// index.js

const express = require("express");
const fetch = require("node-fetch");
const { setTimeout } = require("timers/promises");
const tracing = require("./tracing");

const PORT = process.env.PORT || 5000;
// Default to Quickwit open telemetry endpoint.
const EXPORTER_ENDPOINT =
  process.env.EXPORTER_ENDPOINT || "http://localhost:7281";
const { startSpan } = tracing("quickwit-jaeger-demo", EXPORTER_ENDPOINT);

const randomSleep = async () => {
  const sleepTime = Math.floor(Math.random() * 100) + 1;
  await setTimeout(sleepTime);
};

async function process_ip(_req, res) {
  const currentSpan = startSpan("process_ip");

  let body = await fetch_ip(currentSpan);
  let ip = await parse_ip(body, currentSpan);
  await display_ip(ip, currentSpan);

  currentSpan.end();
  res.json({ clientIp: ip });
}

async function fetch_ip(parrentSpan) {
  const currentSpan = startSpan("fetch_ip", parrentSpan);

  const response = await fetch("https://httpbin.org/ip");
  const body = await response.json();

  currentSpan.setAttribute("status", response.status);
  currentSpan.setAttribute(
    "content-type",
    response.headers.get("content-type")
  );
  currentSpan.setAttribute(
    "content-length",
    response.headers.get("content-length")
  );

  currentSpan.end();
  return body;
}

async function parse_ip(body, parrentSpan) {
  const currentSpan = startSpan("parse_ip", parrentSpan);

  // Sleep for a random amount of time to make the span more visible.
  await randomSleep();

  currentSpan.end();
  return body.origin;
}

async function display_ip(ip, parrentSpan) {
  const currentSpan = startSpan("display_ip", parrentSpan);

  // Sleep for a random amount of time to make the span more visible.
  await randomSleep();

  let message = `Your IP address is ${ip}.`;
  currentSpan.addEvent(message);
  currentSpan.end();
}

const app = express();
app.get("/process-ip", process_ip);
app.listen(PORT, () => console.log(`Listening on port ${PORT}`));
In the above snippets, we are only sending traces. Quickwit can also ingest OpenTelemetry logs in the same way. Please check the OpenTelemetry SDK documentation for your programming environment.
Ingesting traces data with Quickwit
Now that we have done with our application, let’s run it alongside Quickwit and generate some traces to be indexed.
Start Quickwit with OpenTelemetry endpoint and Jaeger endpoint enabled:
QW_ENABLE_OTLP_ENDPOINT=true QW_ENABLE_JAEGER_ENDPOINT=true ./quickwit run
Starts the Node.js application in another terminal and hit http://localhost:5000/process-ip few times with cURL, to generate a few trace data.
node ./index.js
Wait around 10 seconds before they are indexed.
You can now check Quickwit has indexed the trace data by searching the otel-trace-v0 index via cURL.
curl -XPOST http://localhost:7280/api/v1/otel-trace-v0/search -H 'Content-Type: application/json' -d '{
    "query": "resource_attributes.service.name:quickwit-jaeger-demo"
}'
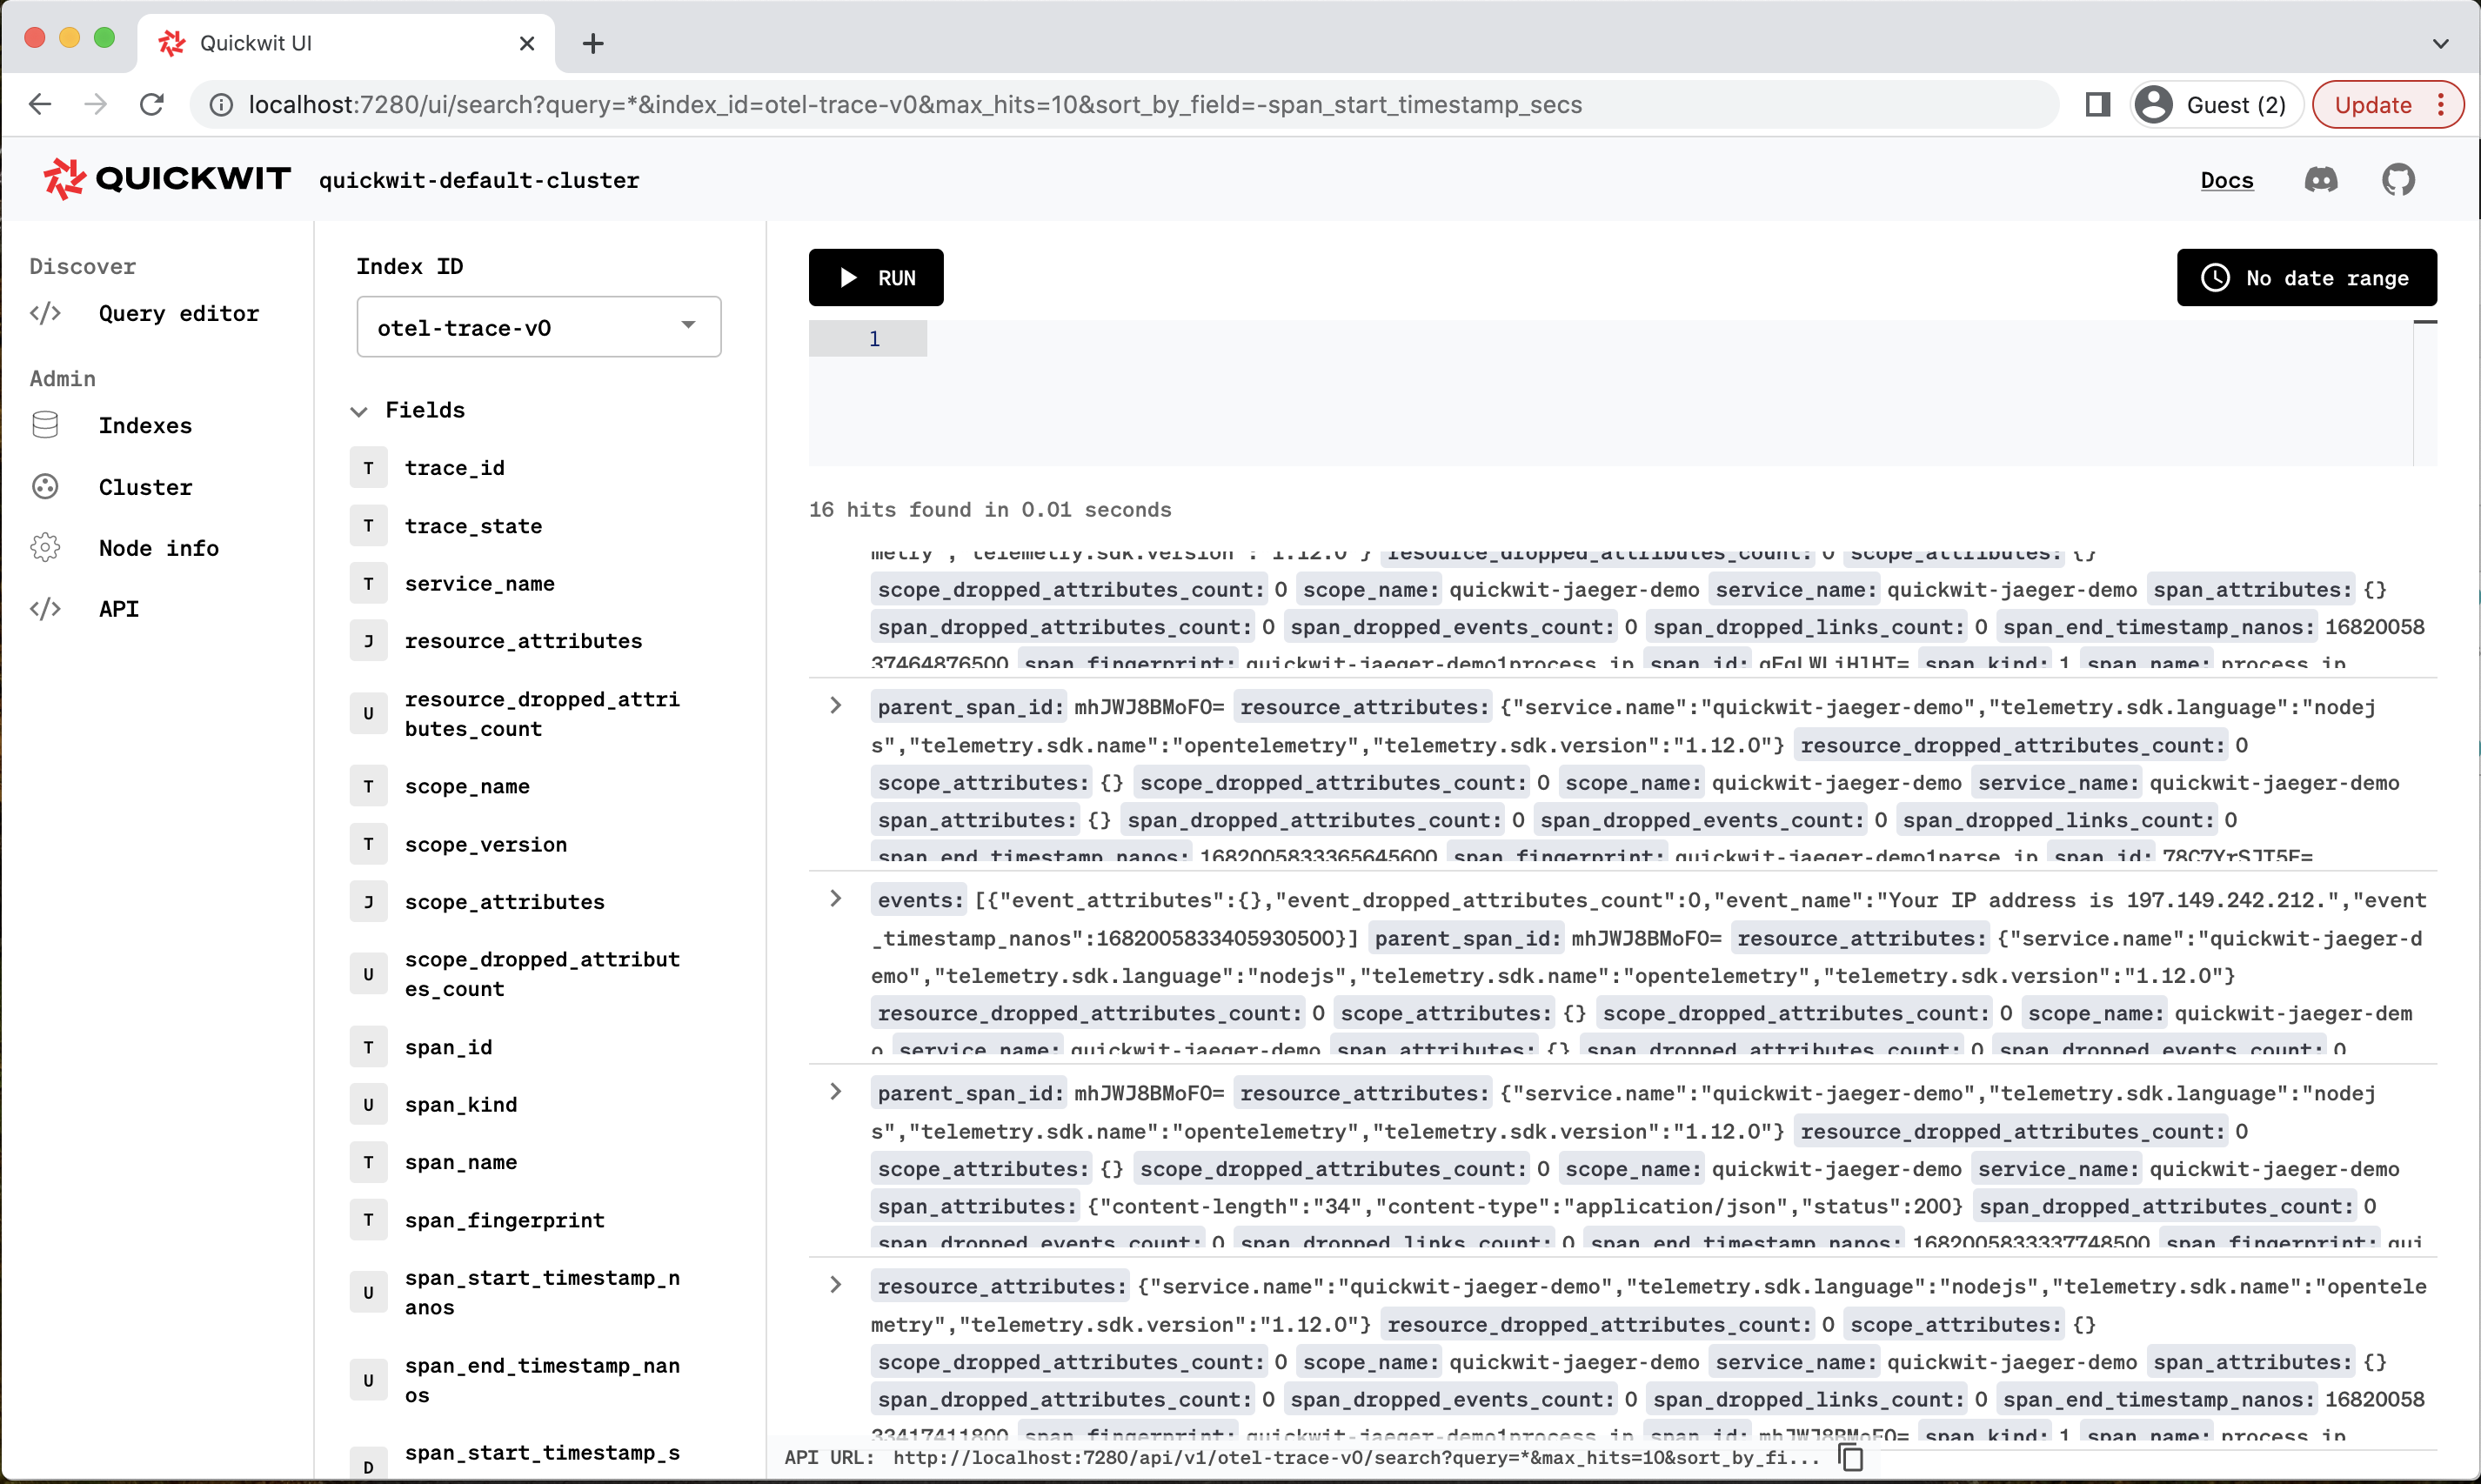
You can also view the data using Quickwit UI http://localhost:7280/ui/search.
Analyzing your application traces using Jaeger UI.
We can initiate a Jaeger UI instance using Docker and specify that it should utilize Quickwit as its backend. However, the process differs between MacOS and Windows, versus Linux, due to certain peculiarities related to container networking.
MacOS & Windows
We can rely on host.docker.internal to get the docker bridge IP address, pointing to our Quickwit server.
docker run --rm --name jaeger-qw \
    -e SPAN_STORAGE_TYPE=grpc-plugin \
    -e GRPC_STORAGE_SERVER=host.docker.internal:7281 \
    -p 16686:16686 \
    jaegertracing/jaeger-query:latest
Linux
By default, Quickwit listens on 127.0.0.1, and will not respond to requests directed to the docker bridge (172.17.0.1). There are different ways to solve this problem. The easiest is probably to use host network mode.
docker run --rm --name jaeger-qw --network=host \
    -e SPAN_STORAGE_TYPE=grpc-plugin \
    -e GRPC_STORAGE_SERVER=127.0.0.1:7281 \
    -p 16686:16686 \
    jaegertracing/jaeger-query:latest
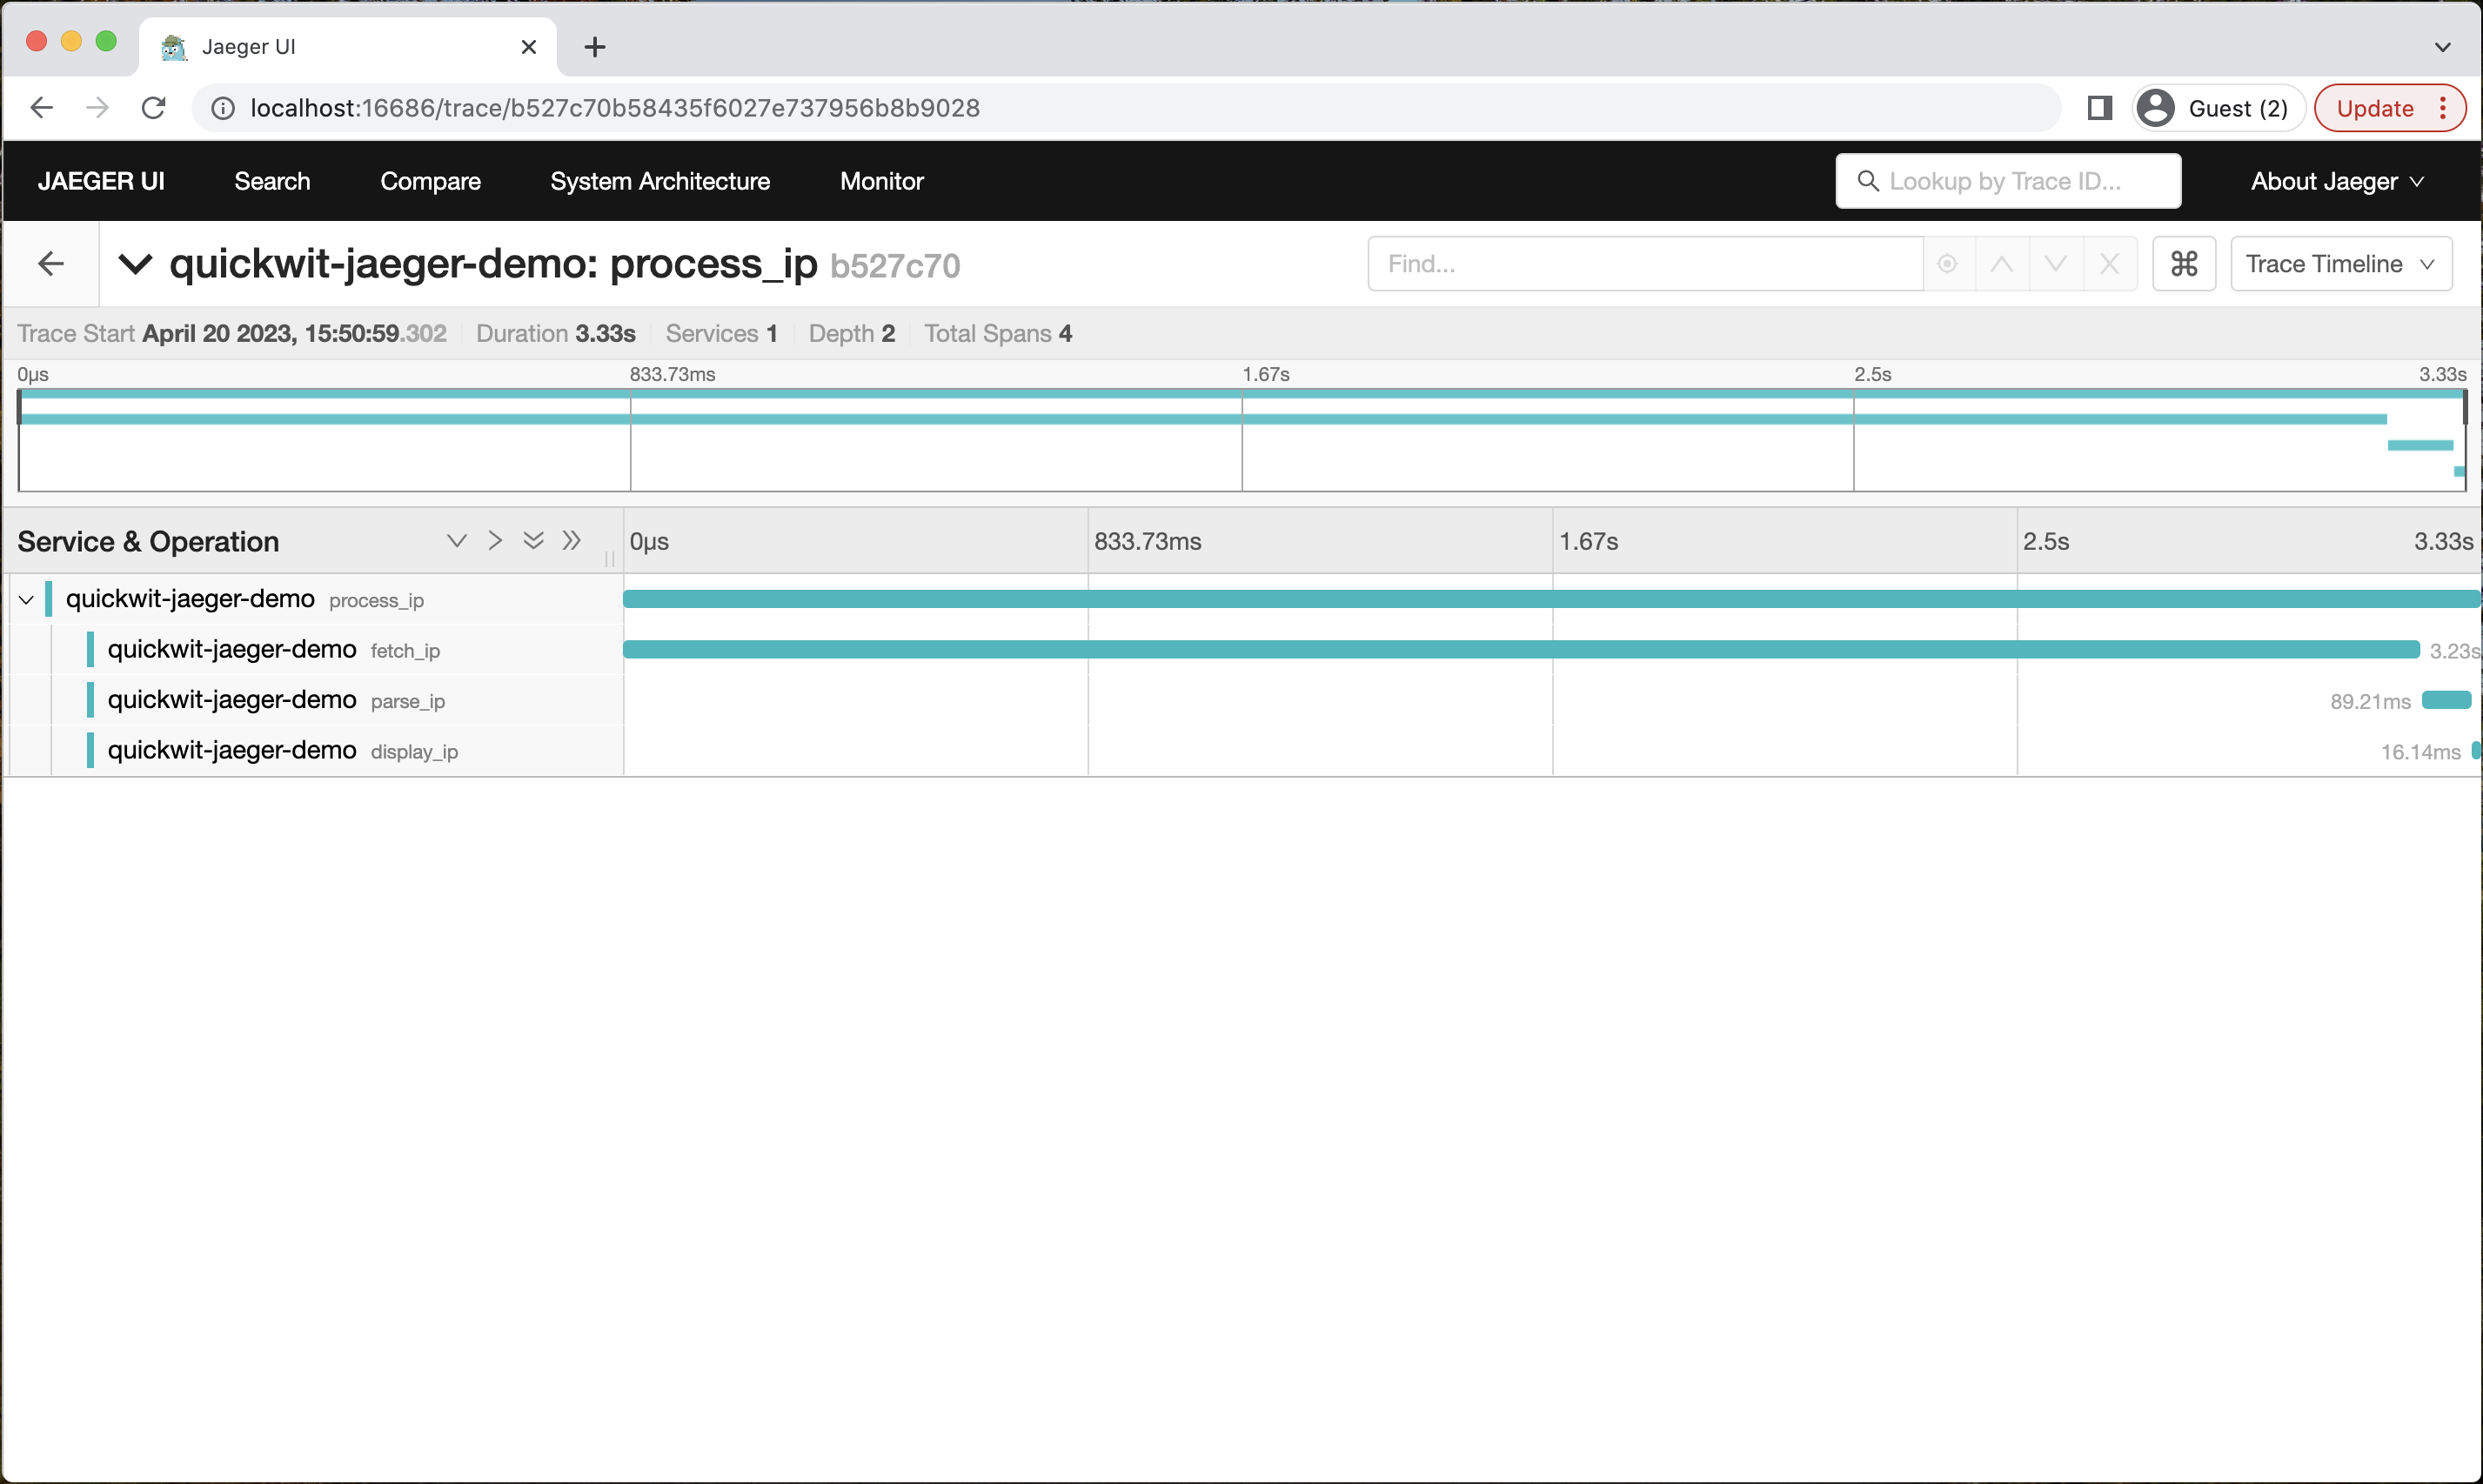
Now let’s open Jaeger UI by navigating to http://localhost:16686 and visualizing our application traces.
In conclusion, setting up Quickwit with Jaeger is a simple process that can provide immense benefits to your distributed applications. With Quickwit as a supported Jaeger backend, you can take advantage of its powerful search capabilities to monitor and analyze your tracing data. By following the steps outlined in this article, you can easily instrument your code, send tracing data to Quickwit and visually analyze them using Jaeger. We hope that this walkthrough has been helpful, and we encourage you to explore this topic further in our docs as well as the OpenTelemetry docs: