Plug Quickwit to Jaeger
In this tutorial, we will show you how Quickwit can eat its own dog food: we will send Quickwit traces into Jaeger and analyze them, which will generate new traces to analyze :)
Start Quickwit
First, start a Quickwit instance with the OTLP service enabled:
QW_ENABLE_OPENTELEMETRY_OTLP_EXPORTER=true \
OTEL_EXPORTER_OTLP_ENDPOINT=http://127.0.0.1:7281 \
./quickwit run
We also set QW_ENABLE_OPENTELEMETRY_OTLP_EXPORTER and OTEL_EXPORTER_OTLP_ENDPOINT environment variables so that Quickwit will send its own traces to itself.
Start Jaeger UI
Let's start a Jaeger UI instance with docker. Here we need to inform jaeger that it should use quickwit as its backend.
Due to some idiosyncrasy associated with networking with containers, we will have to use a different approach on MacOS & Windows on one side, and Linux on the other side.
MacOS & Windows
We can rely on host.docker.internal to get the docker bridge ip address, pointing to our quickwit server.
docker run --rm --name jaeger-qw \
    -e SPAN_STORAGE_TYPE=grpc-plugin \
    -e GRPC_STORAGE_SERVER=host.docker.internal:7281 \
    -p 16686:16686 \
    jaegertracing/jaeger-query:latest
Linux
By default, quickwit is listening to 127.0.0.1, and will not respond to request directed
to the docker bridge (172.17.0.1). There are different ways to solve this problem.
The easiest is probably to use host network mode.
docker run --rm --name jaeger-qw  --network=host \
    -e SPAN_STORAGE_TYPE=grpc-plugin \
    -e GRPC_STORAGE_SERVER=127.0.0.1:7281 \
    -p 16686:16686 \
    jaegertracing/jaeger-query:latest
Search traces in Jaeger UI
As Quickwit is indexing its own traces, you should be able to see them in Jaeger UI after 5 seconds (the time it takes for Quickwit to do its first commit).
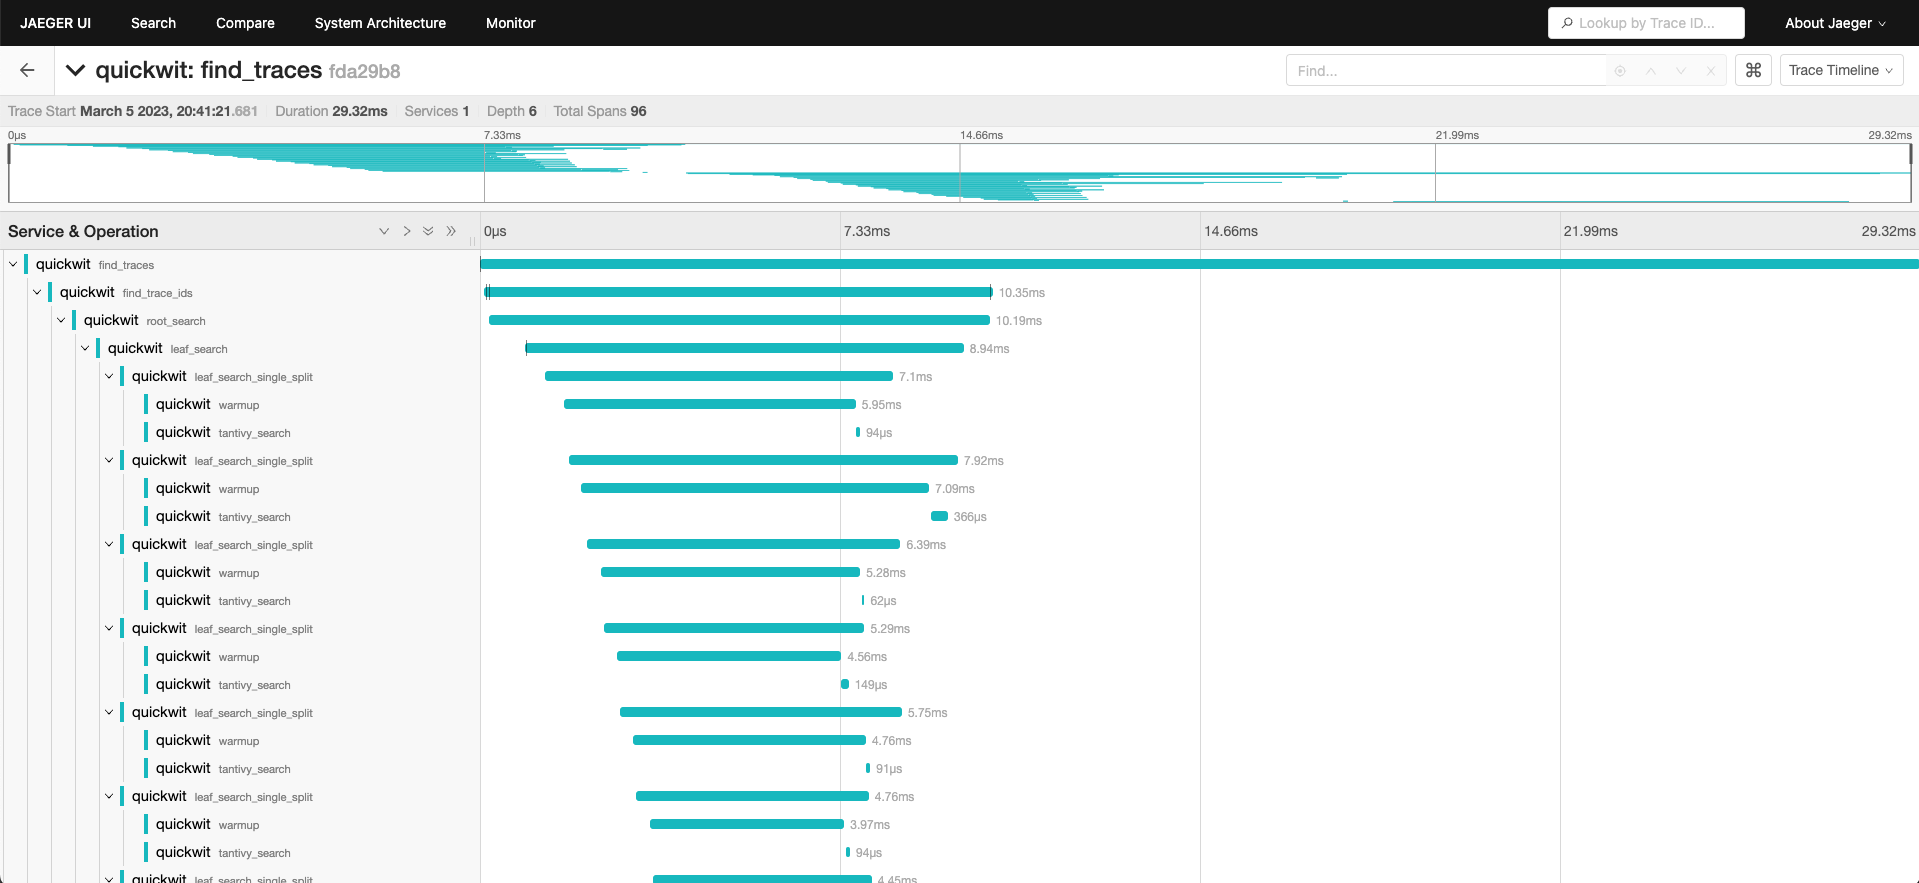
Open the Jaeger UI at http://localhost:16686 and search for traces! By executing search queries, you will then see Quickwit's own traces:
find_tracesis the endpoint called when you search for traces in Jaeger UI, it then callsfind_trace_ids.find_traces_idsis doing an aggregation query on spans to get unique trace IDs.root_searchis Quickwit search entry point. It calls search on each split (piece of index) in parallel, in a distributed manner, or just locally if there is only one node.leaf_searchis the search entry point on each node. It callsleaf_search_single_spliton each split.leaf_search_single_splitis the search entry point on a split. It will call consecutivelywarmupandtantivy_search.warmupis the warmup phase of the search. It prefetches data needed to execute the search query.tantivy_searchis the search phase of the search. It is executing the search query at horse speeds with the Tantivy.
Next steps
You are now ready for the next step: instrumenting your application and sending its traces to Quickwit. You can do it:
- In python.
- And in any other language that OpenTelemetry supports.