How to investigate memory usage of your rust program
At Quickwit we have a mindset to create memory efficient and fast software, something that resonates with me personally. I love to create fast software and optimize it, since it has a really satisfying feedback cycle.
Memory consumption can easily become a problem, when indexing and merging data due to the large data volume being processed. In my opinion, occasionally measuring your application is indispensable to get valuable insights.
Target audience of this blogpost are people who are interested in software optimization. Some rust and search engine knowledge may be beneficial to follow some parts, but is not strictly required.
Heaptrack
heaptrack is a nice utility to visualize memory consumption on a timescale, and it is dead-easy to use. It only tracks heap-allocations though. It also ships with debian. If you have a recent enough distro, install it with:
sudo apt-get install heaptrack
So let's install and run quickwit to index our data and see what heaptrack can tell us about our memory consumption.
The dataset is a 16GB hdfs log with the following hdfs_index_config.yaml.
version: 0 # File format version.

index_id: "hdfs"

doc_mapping:
  field_mappings:
    - name: timestamp
      type: i64
      fast: true
    - name: severity_text
      type: text
      tokenizer: raw
    - name: body
      type: text
      tokenizer: default
      record: position
    - name: resource
      type: object
      field_mappings:
        - name: service
          type: text
          tokenizer: raw
  tag_fields: ["resource.service"]

indexing_settings:
  timestamp_field: timestamp

search_settings:
  default_search_fields: [severity_text, body]
quickwit index create --index-config ./hdfs_index_config.yaml --config=quickwit_config.json

cat hdfs-log.json | heaptrack quickwit index ingest --index hdfs --config=quickwit_config.json

heaptrack --analyze heaptrack.quickwit.2109522.gz
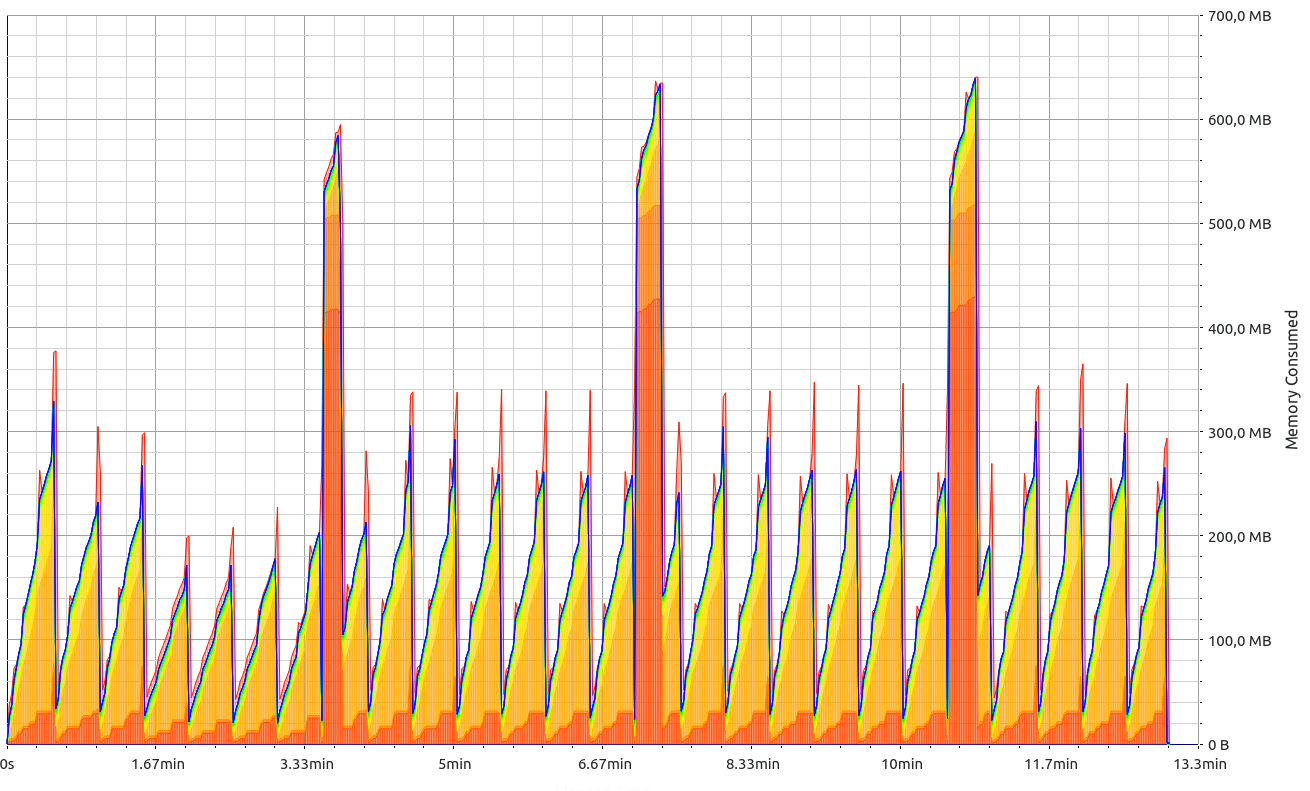
600MB max heap memory consumption for 16Gb data, that looks pretty good, right? Even my raspberry pi could index this.
Fair enough, but what is this ugly peak, and can we maybe like remove it?
Let's try to investigate. heaptrack comes bundled with another tool heaptrack_print, that generates a summary of the profile.
heaptrack_print heaptrack.quickwit.2109522.gz


PEAK MEMORY CONSUMERS
528.00MB peak memory consumed over 686242304 calls from
0x56135a16f5c4
  in /home/pascal/.cargo/bin/quickwit
402.65MB consumed over 69 calls from:
    alloc::raw_vec::RawVec$LT$T$C$A$GT$::reserve::do_reserve_and_handle::h2b5cd3c6459cd557
      in /home/pascal/.cargo/bin/quickwit
    _$LT$alloc..vec..Vec$LT$T$GT$$u20$as$u20$alloc..vec
    ..spec_from_iter..SpecFromIter$LT$T$C$I$GT$$GT$::from_iter::h5fe32505140f85a0
      in /home/pascal/.cargo/bin/quickwit
    tantivy::indexer::merger::IndexMerger::write::hf2f8719e6428e59e
      in /home/pascal/.cargo/bin/quickwit
    tantivy::indexer::segment_updater::merge::hd71502b462dbb343
      in /home/pascal/.cargo/bin/quickwit
    _$LT$core..future..from_generator..GenFuture$LT$T$GT$$u20$as$u20$core
    ..future..future..Future$GT$::poll::hd6e25d15cec97c4f
      in /home/pascal/.cargo/bin/quickwit
    futures_executor::thread_pool::PoolState::work::h98556dbe39869ced
      in /home/pascal/.cargo/bin/quickwit
    std::sys_common::backtrace::__rust_begin_short_backtrace::h54c13adaa4af2bc9
      in /home/pascal/.cargo/bin/quickwit
    core::ops::function::FnOnce::call_once$u7b$$u7b$vtable.shim$u7d$$u7d$::hd16673a142e56ed8
      in /home/pascal/.cargo/bin/quickwit
    _$LT$alloc..boxed..Box$LT$F$C$A$GT$$u20$as$u20$core..ops..function
    ..FnOnce$LT$Args$GT$$GT$::call_once::h59eef3b9c8a82350
      at /rustc/73422130ee96c09e7214c876a3600ac1f32aa8c8/library/alloc/src/boxed.rs:1638
      in /home/pascal/.cargo/bin/quickwit
    _$LT$alloc..boxed..Box$LT$F$C$A$GT$$u20$as$u20$core..ops..function
    ..FnOnce$LT$Args$GT$$GT$::call_once::hb5bbe017c347469c
      at /rustc/73422130ee96c09e7214c876a3600ac1f32aa8c8/library/alloc/src/boxed.rs:1638
    std::sys::unix::thread::Thread::new::thread_start::h62931528f61e35f5
      at library/std/src/sys/unix/thread.rs:106
    start_thread
      in /lib/x86_64-linux-gnu/libpthread.so.0
    __clone
      in /lib/x86_64-linux-gnu/libc.so.6
In the snippet above we can see a potential culprit (402.65MB consumed over 69 calls).
But looking at the stacktrace: It ends at IndexMerger::write. This is the toplevel entry function to the merging section in tantivy. Thanks for nothing I guess, investigation finished.
Well ok, not so fast, the reason the stacktrace is incomplete is likely due to inlining. In the final binary the function does simply not exists because its content is moved into the parent function,
so it cannot be traced.
So what happens if we would tell the compiler not to inline any function called by the merge function? Actually we can and it's really simple with #[inline(never)]!
When inlining code prefer to use #[inline] and use #[inline(always)] only when you are really sure (backed by benchmarks).
The compiler does a pretty good job on inlining most of the time, and when #[inline(always)] is applied on the wrong level
it may mess up the compilers inline heuristics, so that some functions may not be inlined anymore.
This time let's use the gui, because it allows drill downs.
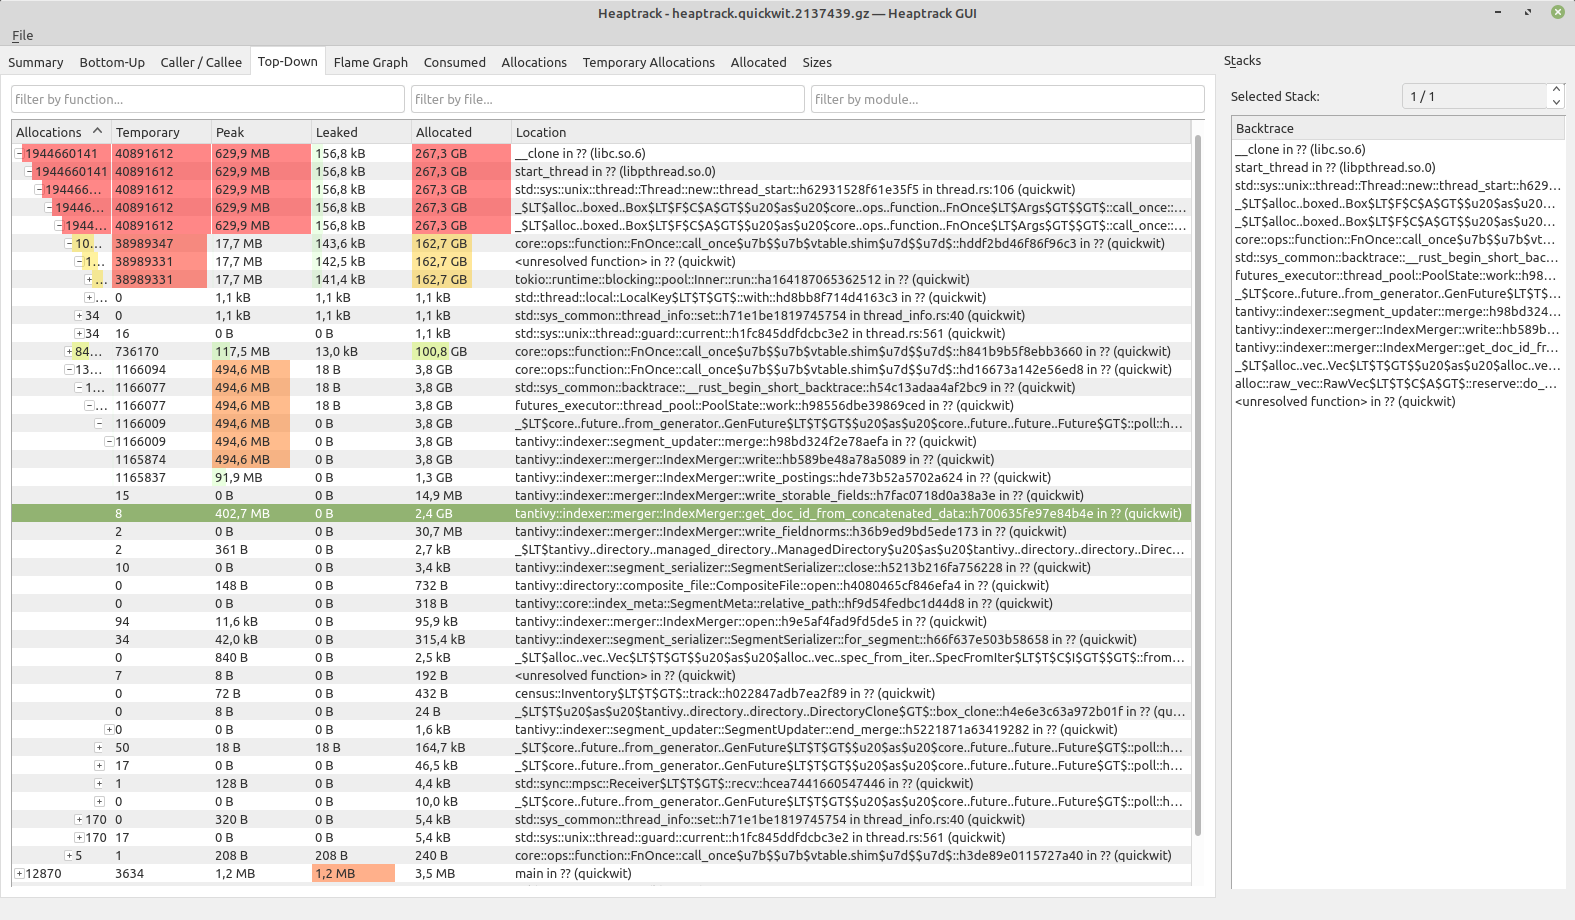
So here finally we have the culprit, consumer of memory, destroyer of flat memory profiles: get_doc_id_from_concatenated_data. Who made this?

Turns out it was me! (classic) This function is part of index-sorting introduced in tantivy v0.15. A more detailed introduction is part of the tantivy repo.
As a short summary: An index in tantivy can be sorted by a field. During the merge of segments, the sorting is applied. The sorting is applied via a SegmentDocIdMapping that is basically a list of Vec<(Old Docid, New Segment)>, where index is the new Docid.
SegmentDocIdMapping is causing the memory consumption.
Looking at the code there are 3 things we can do:
- Reduce space used by the elements in the vec of
SegmentDocIdMapping - Avoid oversizing the vec
- Use an enum to not create the mapping in the not sort case
Reduce space used by the elements in the doc id mapping
Let's have a look at the SegmentDocIdMapping, which is generated by get_doc_id_from_concatenated_data.
Currently we consume 16 bytes per entry (DocId 4bytes, SegmentReader 8bytes, SegmentOrdinal 4bytes).
But SegmentReader is actually just a convenience accessor and could be replaced by always using ordinal. That saves us 8 bytes per element!
/// Struct to provide mapping from new doc_id to old doc_id and segment.
#[derive(Clone)]
pub(crate) struct SegmentDocIdMapping<'a> {
    new_doc_id_to_old_and_segment: Vec<(DocId, SegmentReaderWithOrdinal<'a>)>,
    is_trivial: bool,
}

#[derive(Clone, Copy)]
pub(crate) struct SegmentReaderWithOrdinal<'a> {
    pub reader: &'a SegmentReader,
    pub ordinal: SegmentOrdinal,
}
/// Struct to provide mapping from new doc_id to old doc_id and segment.
#[derive(Clone)]
pub(crate) struct SegmentDocIdMapping {
    new_doc_id_to_old_and_segment: Vec<(DocId, SegmentOrdinal)>,
    is_trivial: bool,
}
SegmentOrdinal is 4bytes wide, but we will hardly have the need to address 4_294_967_296 segments right? 2bytes should do it, which sets the max segments we can merge at once to 65536. Now if you expect that we've saved another 2bytes, that is not the case. Due to struct padding the struct will still consume 8bytes.
Actually rust provides something for that case via alignment modifiers. But there is a real downside, padding is added for performance reasons (and sometimes correctness). Accessing a u32 on a 2 bytes boundary is unaligned memory access something that the cpu isn't optimized for! Now we are entering the very interesting realm of trading memory for performance. As we are already infinitely fast and consume basically no memory, it is hard to decide what to optimize for? (minor exaggeration here :))
A qualified answer can only be provided by benchmarking. SegmentOrdinal in the mapping is used extensively in the merge, so let's postpone this and see where we are now and what optimization we can apply without any trade-off.
The compiler adds paddings to structs, so that the biggest element is aligned to its boundaries. That also means there may be free space in your struct.
E.g. having u64 in a struct means the compiler will add padding so that the u64 can be 8-byte aligned.
(memory alignment rules are a little more complex and simplified here.)
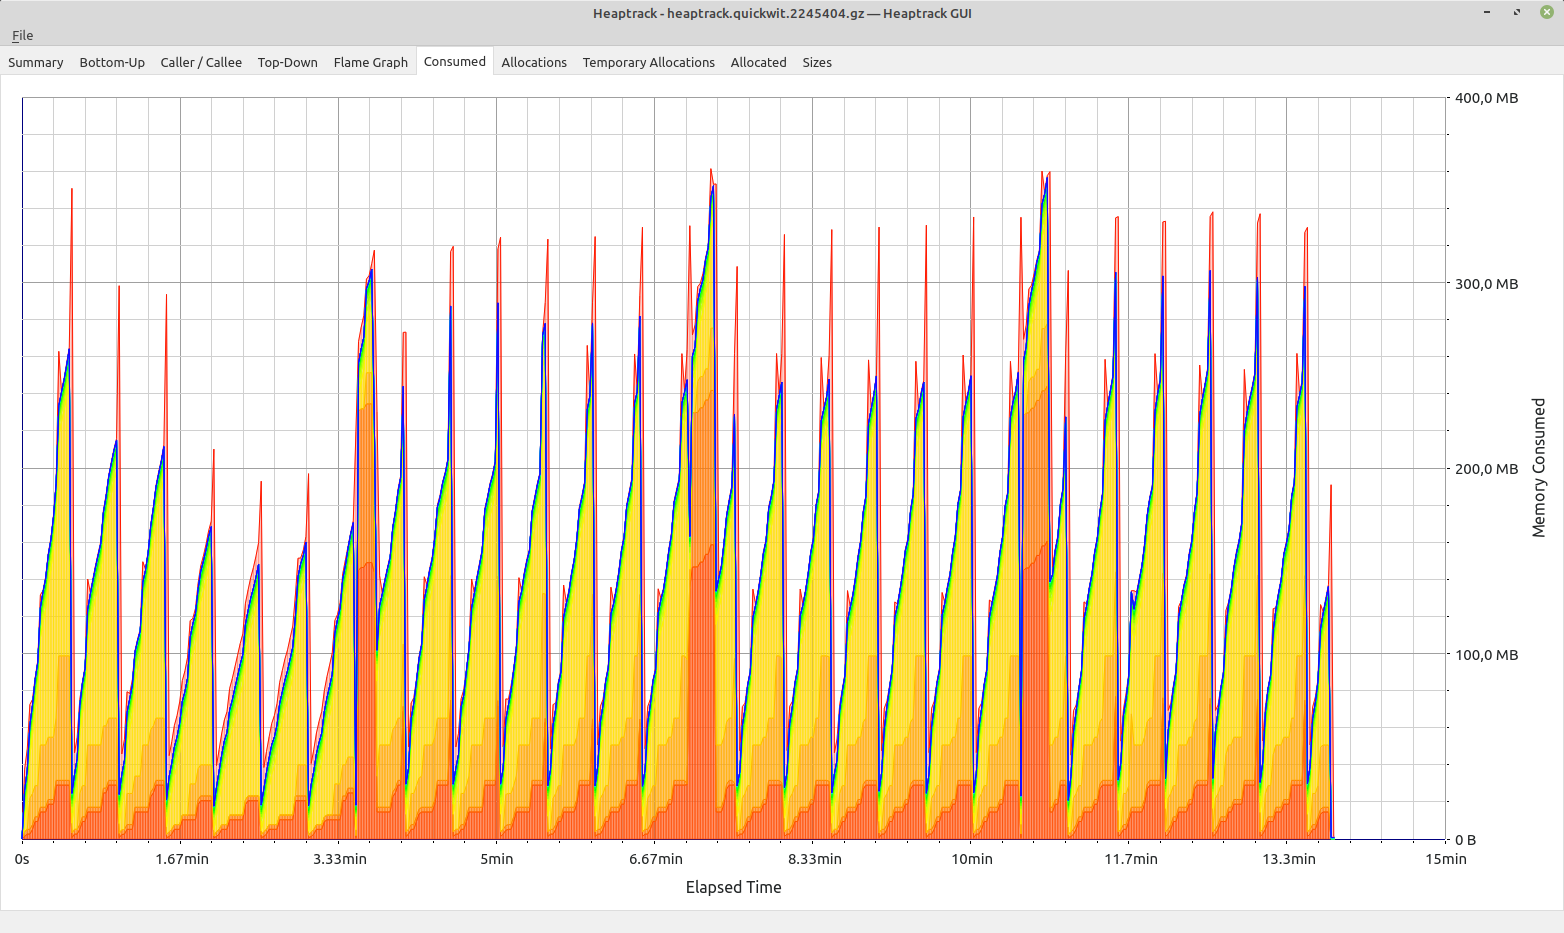
Well this looks great already! We are down to 360MB peak heap consumption.
Avoid oversizing the vec
Currently when creating the SegmentDocIdMapping, we simply collect into a vec. Vectors double in size when they reallocate.
After doubling, we can expect to only use 50% on average of that newly allocated space.
Let me calculate this on my ridiculous oversized calculator I always carry with me (due to lack of image, I'll leave this up to your imagination): In total that means we waste 25% space on average.
There are cases where rust reserves enough space when using collect() via the SpecExtend specialization. But this requires us to implement size_hint and TrustedLen on our doc_ids_alive Iterator. TrustedLen is nightly currently, so we will take the conservative approach of reserving space on the vec ourselves.
let mapping: Vec<_> = self
    .readers
    .iter()
    .enumerate()
    .map(|(reader_ordinal, reader)| {
        reader
            .doc_ids_alive()
            .map(move |doc_id| (doc_id, reader_ordinal as SegmentOrdinal))
    })
    .flatten()
    .collect();
Ok(SegmentDocIdMapping::new(mapping, true))
let total_num_new_docs = self
    .readers
    .iter()
    .map(|reader| reader.num_docs() as usize)
    .sum();

let mut mapping = Vec::with_capacity(total_num_new_docs);

mapping.extend(
    self.readers
        .iter()
        .enumerate()
        .map(|(reader_ordinal, reader)| {
            reader
                .doc_ids_alive()
                .map(move |doc_id| (doc_id, reader_ordinal as SegmentOrdinal))
        })
        .flatten(),
);
Ok(SegmentDocIdMapping::new(mapping, true))
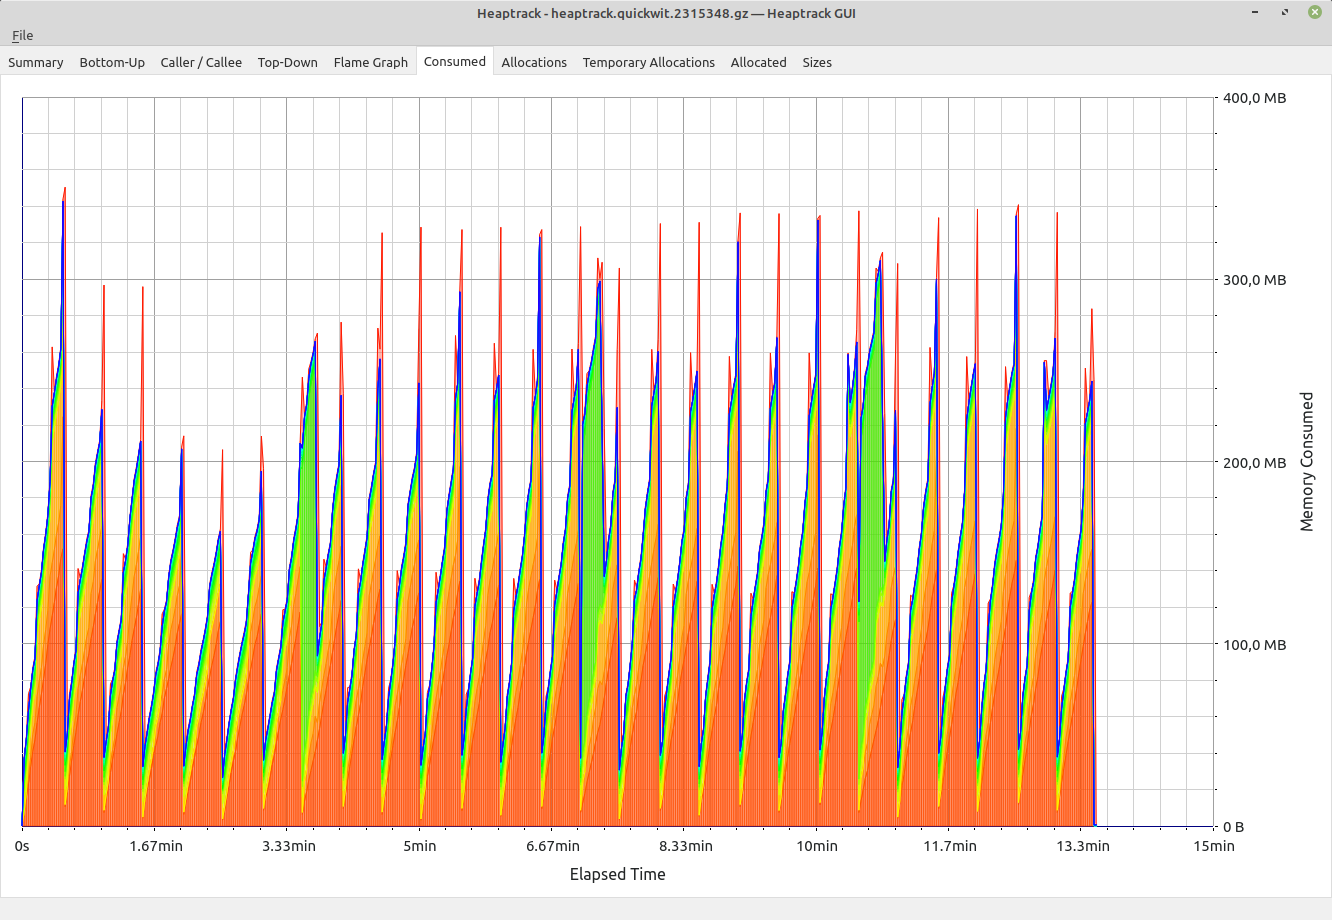
Now, the merge doesn't add overhead compared to regular indexing in this scenario. This is great. I will stop here and continue optimizing offline, because continuing here feels more like:

I hope you found these insights of a typical workflow in optimizing memory consumption interesting. Make sure to like our beautiful, open-sourced, distributed and cost-effective search engine on github.
Feel free to join our community in discord where you can follow our development and participate.